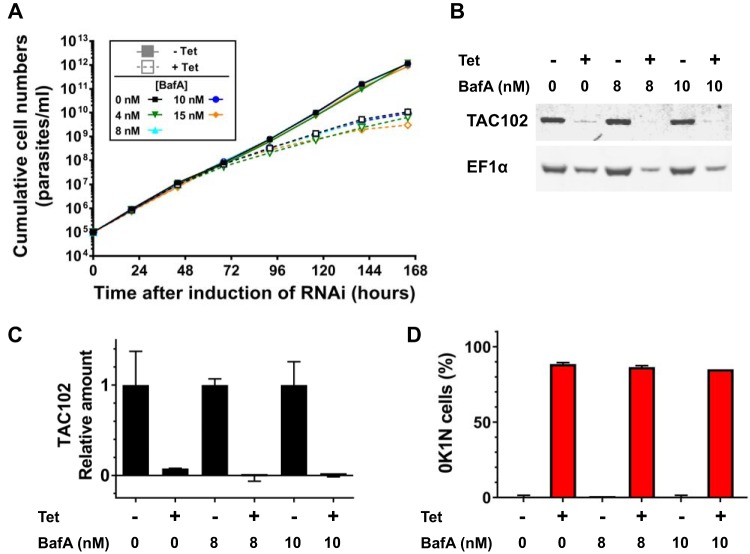
FIG 2.
(A) Cumulative growth curves of T. brucei TAC102 RNAi BF cells cultured in the absence (filled symbols, solid lines) and presence (open symbols, dashed lines) of 1 μg/ml Tet and at various concentrations of BafA. Each data point is the average of 2 growth curves; error bars indicate the SD. (B) Western blot of samples taken at 0, 8, and 10 nM BafA after 168 h, probed with antibodies for TAC102 and EF-1α. (C) Quantification of Western blot signals, taking the average of two replicates (one shown in panel B) and indicating relative protein levels under RNAi-induced (+Tet) to noninduced (−Tet) conditions for each BafA concentration (normalized to EF-1α). (D) Loss of kDNA (0K1N cells) assessed by DAPI staining and microscopy after 168 h of culturing.

