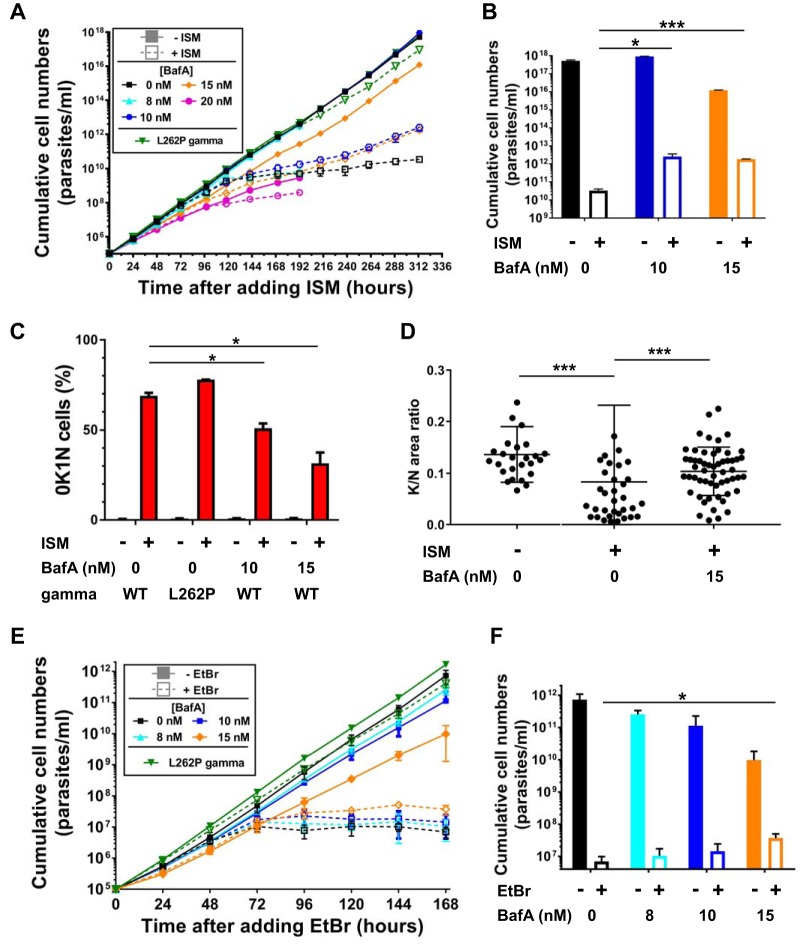
FIG 3.
(A) Cumulative growth curves for T. brucei BF cells cultured in the absence (filled symbols, solid lines) and presence (open symbols, dashed lines) of 0.1 nM ISM and at various concentrations of BafA. In parallel, a cell line expressing an ATPase subunit-γ allele with the L262P mutation was also grown in the absence of presence of 0.1 nM ISM (green triangles and lines). Each data point is the average of two growth curves; error bars indicate the SD. (B) Comparison of cumulative cell numbers (in panel A) after 313 h. Statistical significance of differences was assessed with the Student unpaired t test; 0.01 < P < 0.05 (*) was for 0 nM BafA +ISM versus 10 nM BafA +ISM; P < 0.001 (***) was for 0 nM BafA +ISM versus 15 nM BafA +ISM. (C) Loss of kDNA (0K1N cells) assessed by DAPI staining and microscopy after 96 h of culturing. Statistical significance of differences was assessed with the Student unpaired t test; 0.01 < P < 0.05 (*) was for the wild type (WT) +ISM 0 nM BafA versus WT +ISM 10 nM BafA or versus WT +ISM 15 nM BafA. (D) The relative amount of kDNA in 1K1N cells after 96 h of culturing was assessed by DAPI staining and quantitation of kinetoplast versus nucleus fluorescence intensity. Statistical significance of differences was assessed with the Mann-Whitney test; P < 0.001 (***) for −ISM 0 nM BafA (n = 26) versus +ISM 0 nM BafA (n = 35); P < 0.001 (***) for +ISM 0 nM BafA versus +ISM 15 nM BafA (n = 56). (E) Cumulative growth curves of T. brucei BF cells cultured in the absence (filled symbols, solid lines) and presence (open symbols, dashed lines) of 10 nM EtBr and at various concentrations of BafA. In parallel, a cell line expressing an ATPase subunit-γ allele with the L262P mutation was also grown in the absence of presence of 10 nM EtBr (green triangles and lines). Each data point is the average from four separate growth curves; error bars indicate the SD. (F) Comparison of cumulative cell numbers (in panel E) after 168 h. Statistical significance of differences was assessed with the Wilcoxon rank sum test; 0.01 < P < 0.05 (*) was for +EtBr 0 nM BafA versus +EtBr 15 nM BafA.

