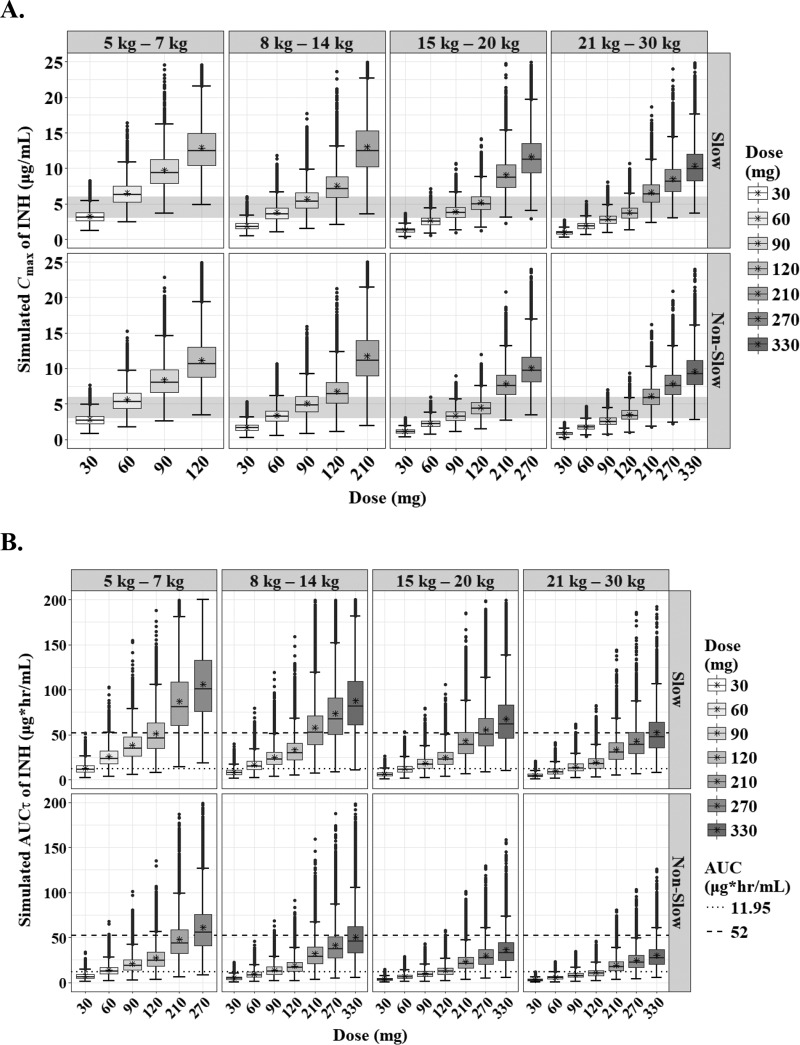
FIG 5.
Box-and-whisker plots of simulated steady-state Cmax (A) and AUCτ (B) of isoniazid according to the weight bands and NAT2 genotypes (slow and nonslow). Each box shows the 25th to 75th percentile of the PK parameters. The bar inside each box represents the median, and the asterisk indicates the mean of the simulated values. The normal range of Cmax (3 to 6 μg/ml) is highlighted in gray. The dashed lines represent target values.

