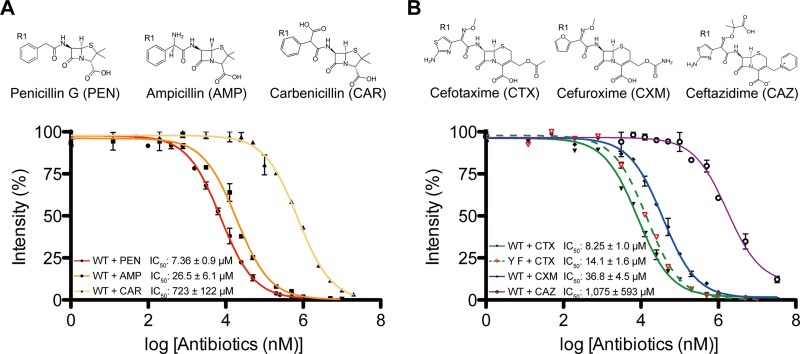
FIG 1.
Inhibition of LmPBPD2 with three penams (A) and three cephems (B). The y axis represents the relative intensity of the Bocillin FL fluorescence, while the x axis represents the logarithmic concentration of the antibiotic. The IC50 values were determined via SDS-PAGE-based Bocillin FL competition assays. Error bars indicate standard deviations based on three independent experiments. IC50 values represent the concentration of unlabeled antibiotics required to reduce the binding of Bocillin FL by 50%. The chemical structures of the β-lactam antibiotics that were used in the present study are shown above the graphs.

