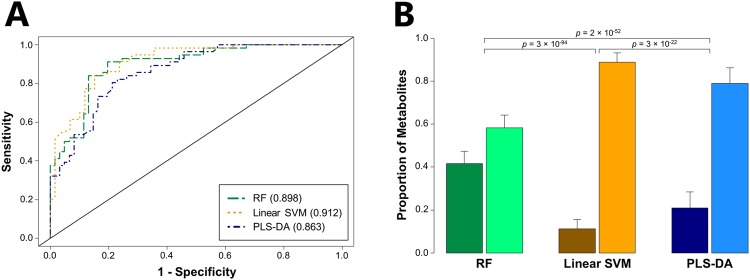
Figure 2.
Analysis of the pan metabolome improves classification accuracy for distinguishing CPE from non-CPE. (A) ROC curves for the discrimination between CPE and non-CPE generated using class probabilities for validation set samples. Green: RF; Orange: linear SVM; Blue: PLS-DA. Values in parentheses indicate AUROC. (B) Bar plot depicting the proportion of discriminatory metabolites (amongst the top 34 most discriminatory metabolites) derived from either the core metabolome (left bar in each pair) or pan metabolome (right bar in each pair). Green: RF; orange: linear SVM; blue: PLS-DA.

