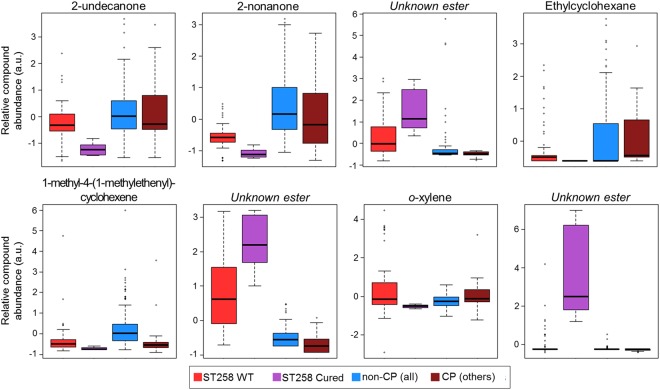
Figure 6.
Plasmid curing alters the volatile metabolome of isolates belonging to ST258. Box plots depict relative compound abundance for metabolites that were: (1) identified as discriminatory between ST258 and non-ST258 by RF, linear SVM, and PLS-DA, and (2) significantly different in relative compound abundance between wild-type ST258 isolates and cured ST258 isolates (p < 0.05 after Benjamini-Hochberg correction). Red: ST258 WT; purple: ST258 cured; blue: non-CP (all STs); dark red: CP isolates (all other STs). The y-axis (in arbitrary units [a.u.]) corresponds to relative compound abundance, as measured by total ion chromatogram (TIC), following log10-transformation, mean-centering, and unit-scaling.

