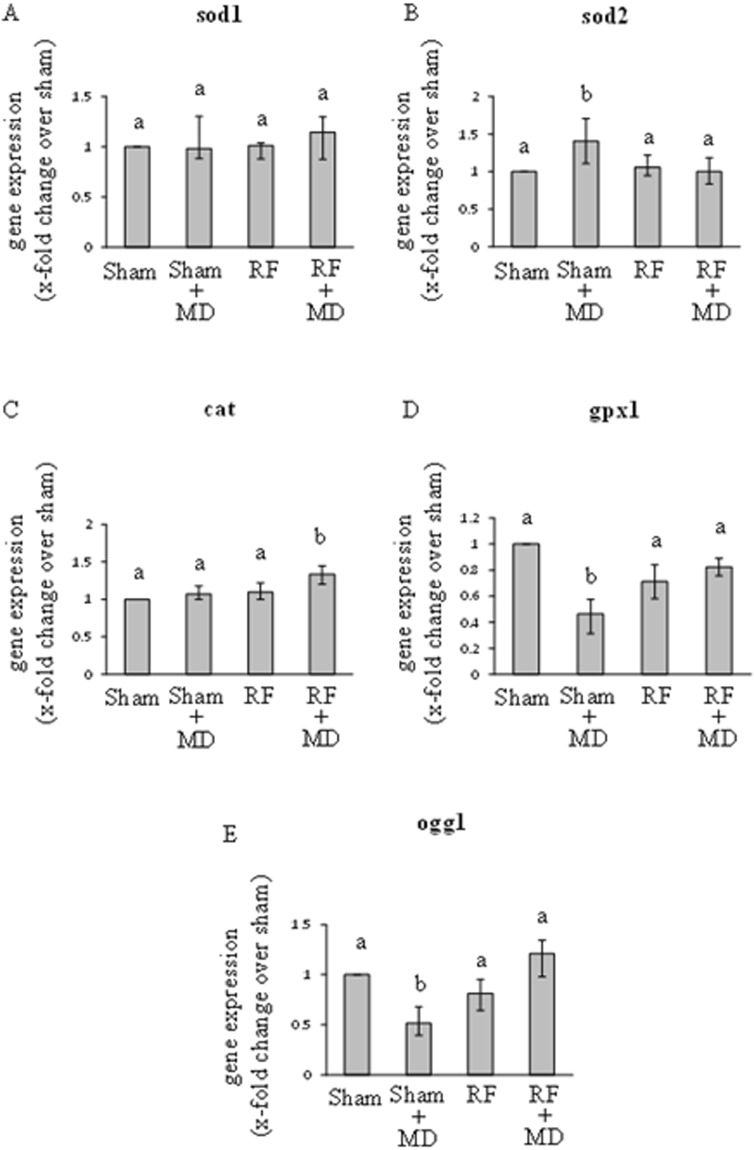
Figure 3.
Medians with interquartile ranges of RT-PCR-based gene expression data (2−ΔΔCt method) for antioxidant and DNA repairing enzymes. Sod1 (superoxide dismutase 1, panel A), sod2 (superoxide dismutase 2, panel B), cat (catalase, panel C), gpx1 (glutathione peroxidase 1, panel D), ogg1 (8-oxoguanine DNA glycosylase 1, panel E). Cells sham-exposed for 20 h (Sham); sham-exposed and treated with 10 µM MD for 1 h (Sham + MD); RF-exposed for 20 h at 0.3 W/Kg (RF); RF-exposed for 20 h and treated with 10 µM MD for 1 h (RF + MD). Same letters indicate no statistically significant differences (please, see main text for statistical details).

