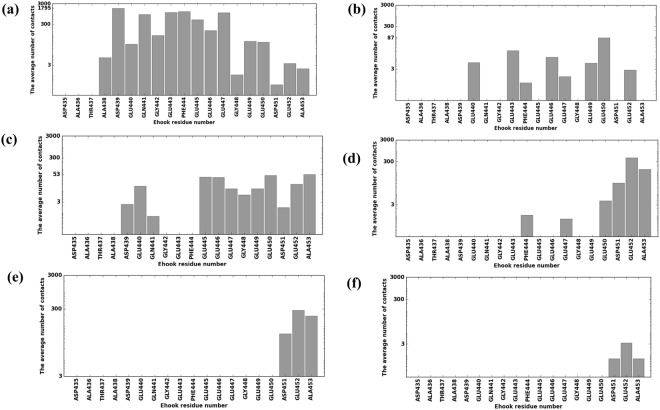
Figure 3.
The MTBD made contacts (in logarithmic scale) along the length of E-hook B as the MTBD approached the microtubule. Bars represent the average number of contacts made by each E-hook B residue and the MTBD at MTBD-microtubule distances of 0, 5, 15, 25, 35, and 45 Å (panels a–f, respectively). Three independent runs (see Methods) were analyzed and results averaged for each distance, and 2000 total frames were analyzed for each run.

