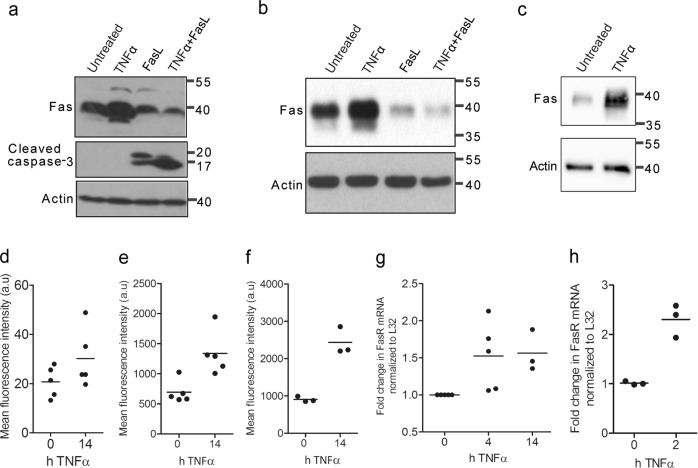
Fig. 2. TNFα treatment leads to increased cell surface Fas expression through transcriptional induction.
Anti-Fas or anti-cleaved caspase-3 western blot analysis of whole lysates of a primary mouse hepatocytes, b Hepa1-6 or c AML12 cells, either untreated, treated with TNFα or FasL alone or pretreated with TNFα for 14 h before adding FasL for 4 h. Actin serves as loading control. Cell surface expression of Fas measured by FACS analysis using the anti-mFas antibody (conjugated to Alexa Fluor 488) significantly increases after 14 h of TNFα treatment in d primary mouse hepatocytes, e Hepa1-6 or f AML12 cells. RT-qPCR analysis of Fas mRNA (shown as fold change normalized to L32 mRNA) of g primary mouse hepatocytes or h Hepa1-6 cells shows that Fas gene transcription increases after TNFα treatment for 2 h or 14 h. a.u. arbitrary units. (d-h) Data were obtained from five, four or three independent experiments as indicated; the horizontal line represents the mean

