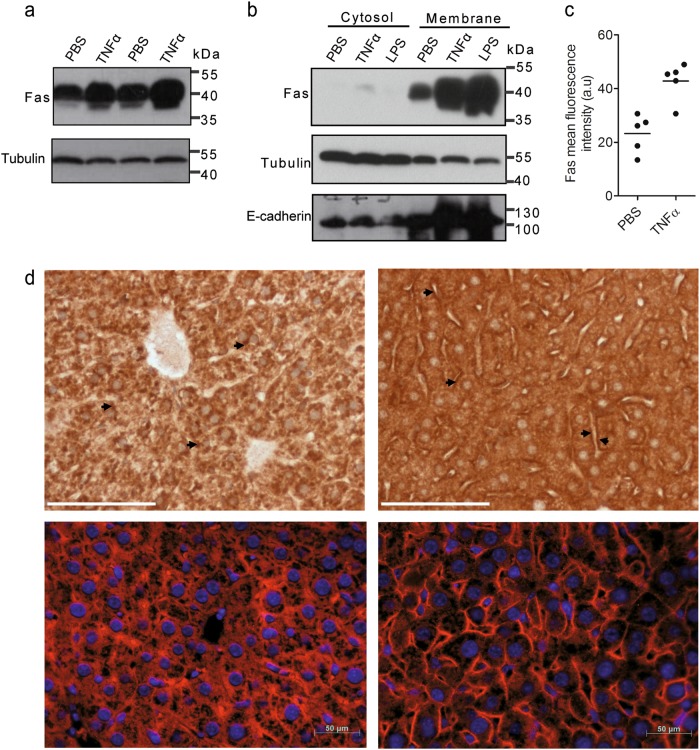
Fig. 3. Fas is induced in hepatocytes in the liver after TNFα or LPS injection into mice.
a Western blot analysis of Fas levels in total liver lysates from two different mice injected with PBS or TNFα for 14 h. b Western blot analysis of Fas expression in the cytosol and membrane fractions of whole liver extracts from mice injected with PBS, TNFα or LPS for 14 h. Actin and tubulin serves as loading markers, E-cadherin as marker for plasma membrane proteins. c FACS analysis of Fas cell surface expression on hepatocytes freshly isolated from the liver of mice injected with PBS or TNFα for 14 h. Data were obtained from five independent experiments. The horizontal line represents the mean. d Anti-mFas DAB (top panels, scale bar: 75 µm) or red immunofluorescence (lower panels, scale bar: 50 µm) staining of liver slices from mice injected with PBS (left panels) or TNFα (right panels) for 14 h. Nuclei are stained with DAPI in the lower panels. Arrows point to the increased surface Fas expression after TNFα treatment

