Figure 1.
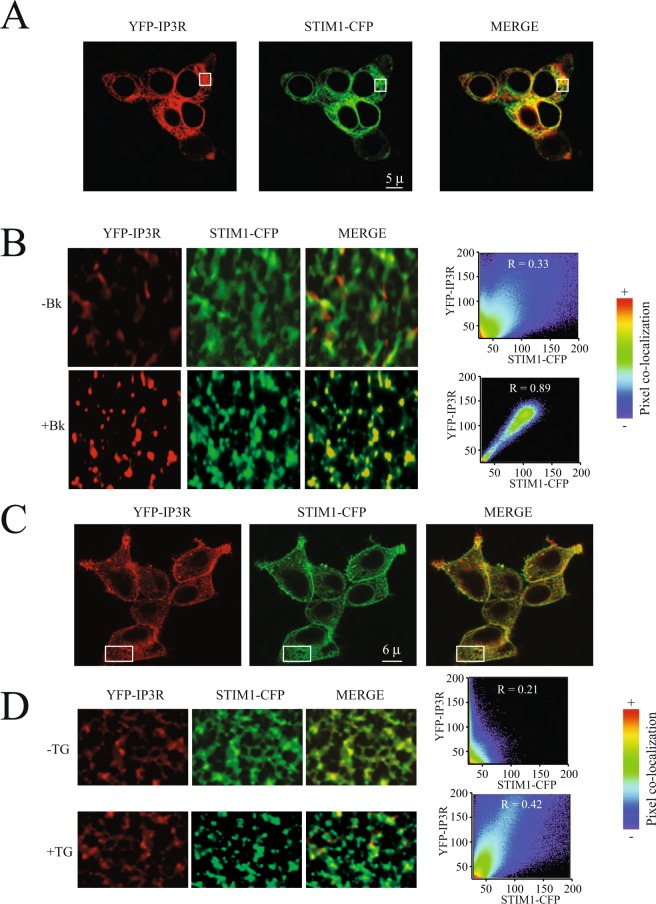
Active IP3R are recruited to the STIM1 puncta upon activation. (A) Typical confocal microscopy images illustrating the localization of the YFP-IP3R (shown in red) and STIM1-CFP (shown in green) at the endoplasmic reticulum in cells stimulated with bradykinin (Bk). (B) Amplification of the areas shown in A with a white rectangle to show in greater details the puncta formation for YFP-IP3R (shown in red) and STIM1-CFP (shown in green). To the right are the co-localization panels obtained with Imaris before and after bradykinin (Bk) stimulation. (C) Typical confocal microscopy images illustrating the localization of the YFP-IP3R (shown in red) and STIM1-CFP (shown in green) at the endoplasmic reticulum in cells stimulated with thapsigargin (TG). (D) Amplification of the areas shown in A with a white rectangle to show in greater details the puncta formation for YFP-IP3R (shown in red) and STIM1-CFP (shown in green). To the right are the co-localization panels obtained with Imaris before and after thapsigargin (TG) stimulation. R represents the Pearson correlation coefficient. Co-localization pixel by pixel was mapped to the pseudo color scale illustrated to the right from 0 (blue) to 1 (red). Scales show 5 microns (μ) for panel A and 6 microns (μ) for panel B.

