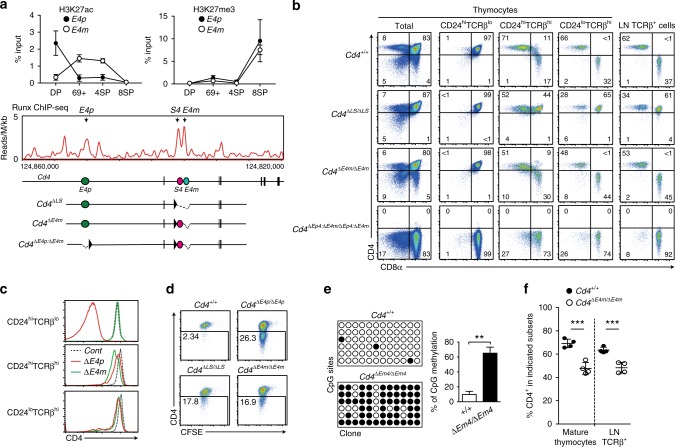
Fig. 2.
Effects of loss of the maturation enhancer, E4m, on CD4 expression. a Upper graphs showing kinetic changes of H3K27ac and H3K27me3 at E4p and E4m regions in pre-selection (DP), freshly selected (CD69+), and CD4 SP (4SP) and CD8 SP (8SP) thymocytes. Summary of three independent ChIP experiments. Means ± SD. (Middle) Runx ChIP-Seq track at the Cd4 gene in total thymocytes. Gene structures and regulatory regions are shown as in Fig. 1a. Schematic structures of mutant Cd4 alleles are shown at the bottom. b Pseudocolor plots showing CD4 and CD8 expression in indicated cell subsets from mice with indicated genotypes. Numbers in quadrants indicate respective cell percentages. Representative results of at least three independent analyses of each genotype. c Histograms showing CD4 expression levels on CD24hiTCRβlo, CD8-negative CD24hiTCRβhi and CD8-negative CD24loTCRβhi thymocytes from Cd4+/+ (dotted), Cd4ΔE4p/ΔE4p (red), and Cd4ΔE4m/ΔE4m (green) mice. One representative of three analyses. d Pseudocolor plots showing CD4 expression and cell divisions five days after in vitro stimulation of sorted peripheral CD4+ T cells from mice with indicated genotypes. Numbers in the indicated gate represent cell percentages. e Bisulfite PCR analyses of naïve CD4+ T cells from Cd4+/+ and Cd4ΔE4m/ΔE4m mice are shown as in Fig. 1d. The right graph shows a summary of three independent experiments. Means ± SD. **p < 0.01 (unpaired student t test, two-sided). f Graph showing percentage of CD4+CD8− cells in mature (CD24loTCRβhi) thymocytes and the lymph node TCRβ+ population of Cd4+/+ and Cd4ΔE4m/ΔE4m mice. Means ± SD. ***p < 0.001 (unpaired student t test, two-sided)

