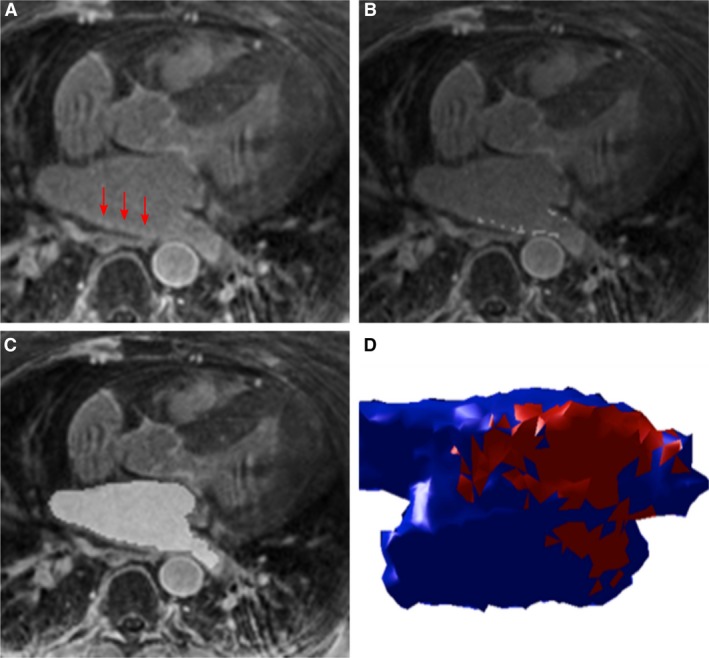
Figure 1.

Quantification of left atrial (LA) fibrosis and volume. (A) Example of a 3D late gadolinium enhancement (LGE) image, with left atrial enhancement indicated by red arrows. (B) Segmentation of LA LGE, now displayed as light gray pixels, quantified by a semi‐automatic threshold method. (C) Segmented LA cavity in light gray, used for biplane area‐length calculation of LA volume. (D) 3D rendering of the LA, with healthy myocardium in blue and fibrosis in red.
