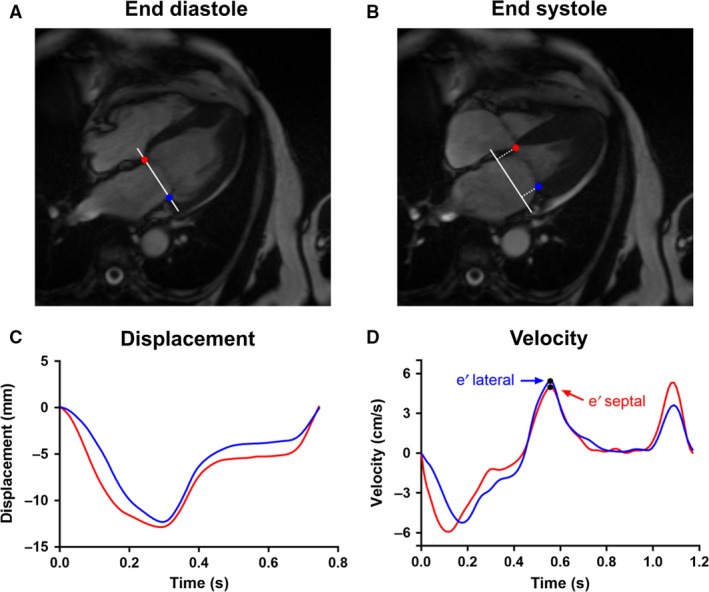
Figure 2.

Illustration of e′ calculation. (A) The septal (red) and lateral (blue) mitral annular points were manually indicated in the end‐diastolic timeframe of the four‐chamber view. These points also define the mitral annular plane (white). Tracking of the points yields the perpendicular displacement relative to the end‐diastolic annular plane, shown in (B) for the end‐systole. (C) The resultant displacement curve for both points, septal in red and lateral in blue. (D) Velocity curve for both points, with the peak velocity (e′) indicated.
