
Figure 4.
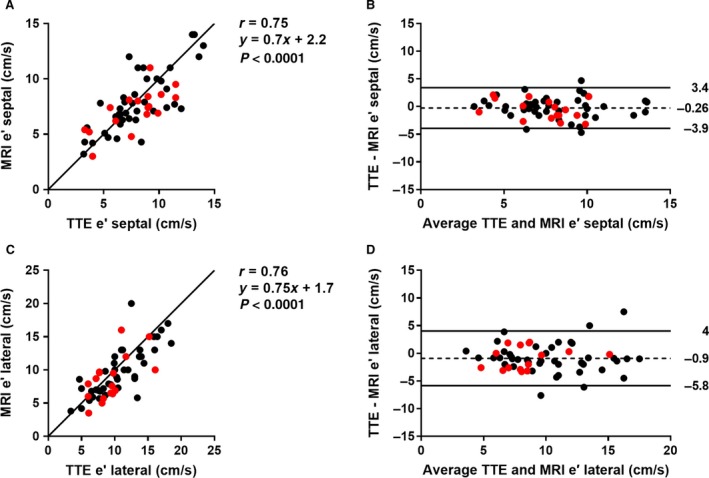
Validation of e′ by magnetic resonance imaging (MRI) with transthoracic echocardiography (TTE). (A) Scatter plot of septal e′ (n = 59). Red dots represent patients with atrial fibrillation. Solid line is the line of identity. (B) Bland‐Altman plot of septal e′. Solid lines represent the 95% confidence interval, dashed line the mean bias. (C) Scatter plot of lateral e (n = 59)′. (D) Bland‐Altman plot of lateral e′.