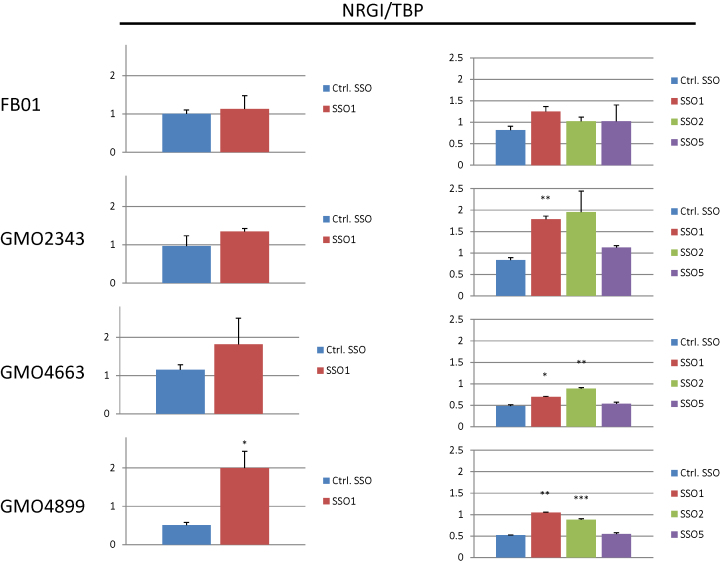
Figure 9.
SSO treatment of FD patient cell lines restores NRG1 expression. Transfection of 12 nM IKBKAP SSOs or a control SSO into three different FD patient fibroblasts (GMO2343, GMO4663 and GMO4899) or a control fibroblast (FB01) was analyzed for NRG1 expression by qPCR and normalized to TBP. Left and right panel represent different experiments. Left: error bars indicates SEM, n ≥ 3 ***P-value < 0.001, **P-value < 0.01, *P-value < 0.05 compared to control SSO. Right: error bars indicates SEM, n ≥ 2 ***P-value < 0.001, **P-value < 0.01, *P-value < 0.05 compared to control SSO.

