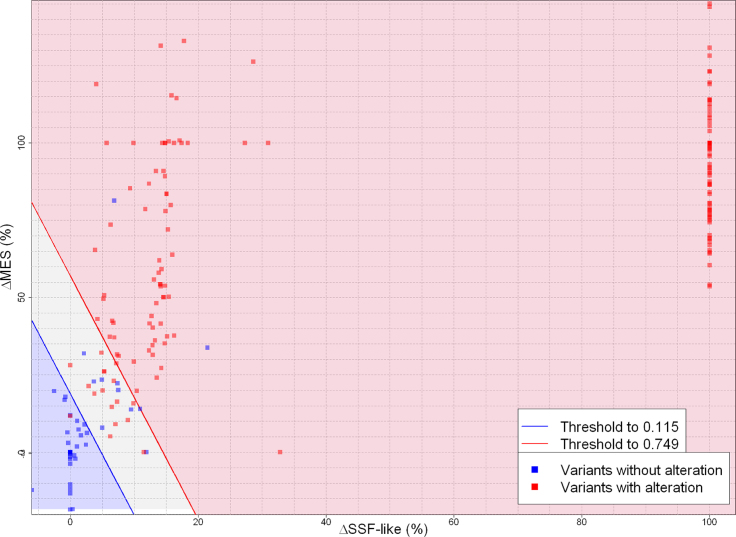
Figure 5.
SPiCE graphical ouput results on BRCA1/BRCA2 validation set (n = 160). Representation of variants according to their SSF-like and MES scores variations in percentage. Blue area represents variants with probability of splicing alteration under decision threshold of optimal sensitivity, red area corresponds to probability upper decision threshold of optimal specificity and gray area is probability between these two thresholds. Blue points are variants without splicing effect and red points are variants altering splicing.

