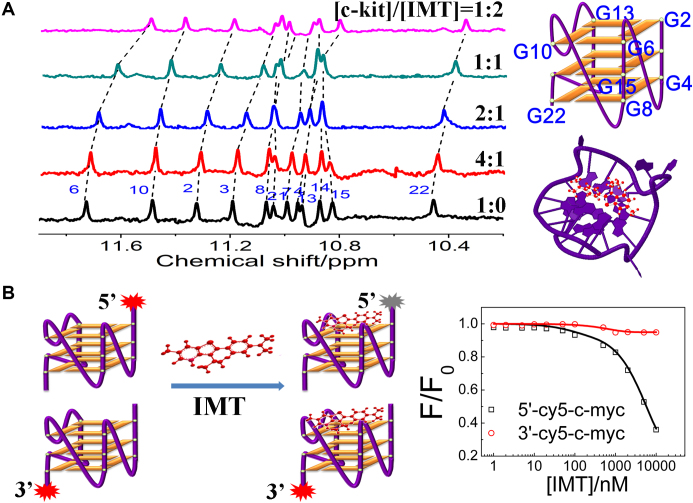
Figure 4.
(A) 1H-NMR spectra of the c-kit G-quadruplex DNA (0.5 mM) with increasing concentrations of IMT in 20 mM PBS (pH 7.0, 90% H2O/10% D2O) at 25°C. (B) (left panel) Schematic representation of G-quartet selectivity analysis. (right panel) The ratio (F/F0) of fluorescence intensity of Cy5-labeled c-kit (0.1 μM) as a function of IMT concentration in 20 mM Tris–HCl (pH 7.4) with 40 mM KCl. F0 and F represent the fluorescence intensity of Cy5-quadruplex before and after interacting with IMT, respectively.

