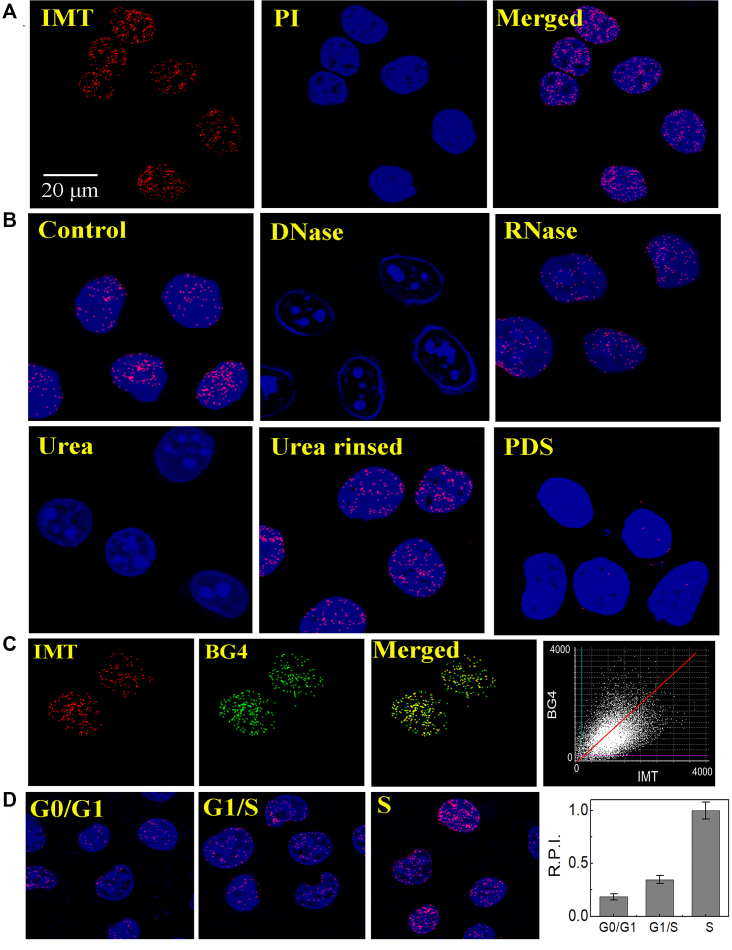
Figure 5.
(A) Confocal imaging of fixed Hela cells stained with IMT (4 µM), nucleus dye PI and Merge images. (B) Fluorescent microscopy analysis of Hela cells stained with IMT (4 µM) and PI before and after treatment of cells with DNase I, RNase T1, urea, rinsing to remove urea, and PDS (8 µM). (C) (left panels) Co-localization images of fixed Hela cells stained with IMT and BG4, and merge images demonstrate that co-localization of IMT/BG4. (right panel) Pixel fluorogram from the section displayed in left panels. (D) (left panels) Confocal imaging of synchronized fixed Hela cells at the G0/G1 and G1/S boundaries, as well as during S phase stained with IMT (4 µM). (right panel) relative pixel intensity (R.P.I.) corresponding to each phase (∼300 cells were quantified for each phase). The pixel intensity of S phase is defined as 1.0. For clarity, the images were presented in pseudocolors of red (IMT), blue (PI) and green (BG4).

