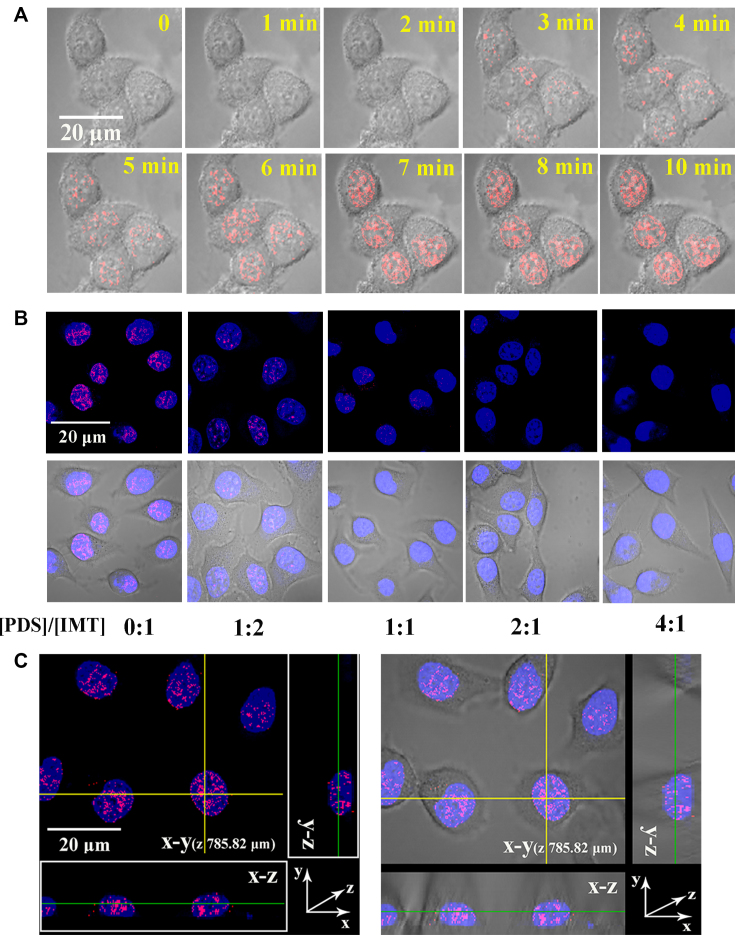
Figure 6.
(A) Time-lapse CLSM images of Hela cells treated with IMT (4 µM). IMT fluorescence images were continuously collected upon IMT being titrated in the cell culture medium. (B) CLSM images of living Hela cells stained by IMT (4 µM) with increasing concentrations of PDS. (C) Three-dimension (3D) confocal imaging of the live Hela cells incubated with IMT (4 µM). For clarity, the images were presented in pseudocolors of red (IMT). The nuclei were counterstained with SYTO®59 (blue).

