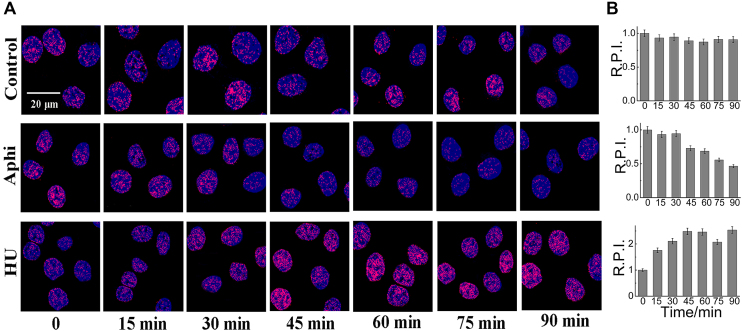
Figure 7.
(A) Confocal imaging of live Hela cells stained with IMT (4 µM) before and after treatment of Aphidicolin (5 µM) and Hydroxyurea (HU, 15 µM) at different time point. (B) Relative pixel intensity (R.P.I.) corresponding to each group displayed in right panels (∼300 cells were quantified for each group). The pixel intensity measured at 0 min is defined as 1.0. The standard error of the mean was calculated from three replicates.*P<0.001.

