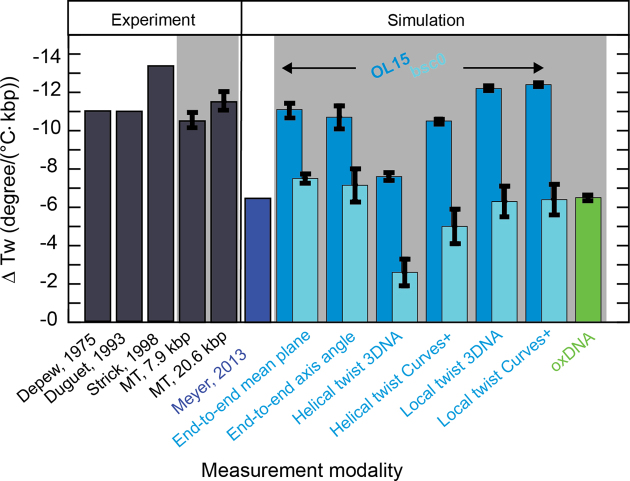
Figure 4.
Values for the change of DNA twist with temperature ΔTw(T) from measurements and simulations. Dark gray bars indicate values obtained from experiments. Indicated with the light grey background are values that were obtained as part of this work. Blue colors refer to data from all-atom MD simulations. Lighter blue colors represent data generated in this work with the OL15 and bsc0 force fields, respectively. Green represents the value gained by coarse-grained oxDNA simulations within this work.

