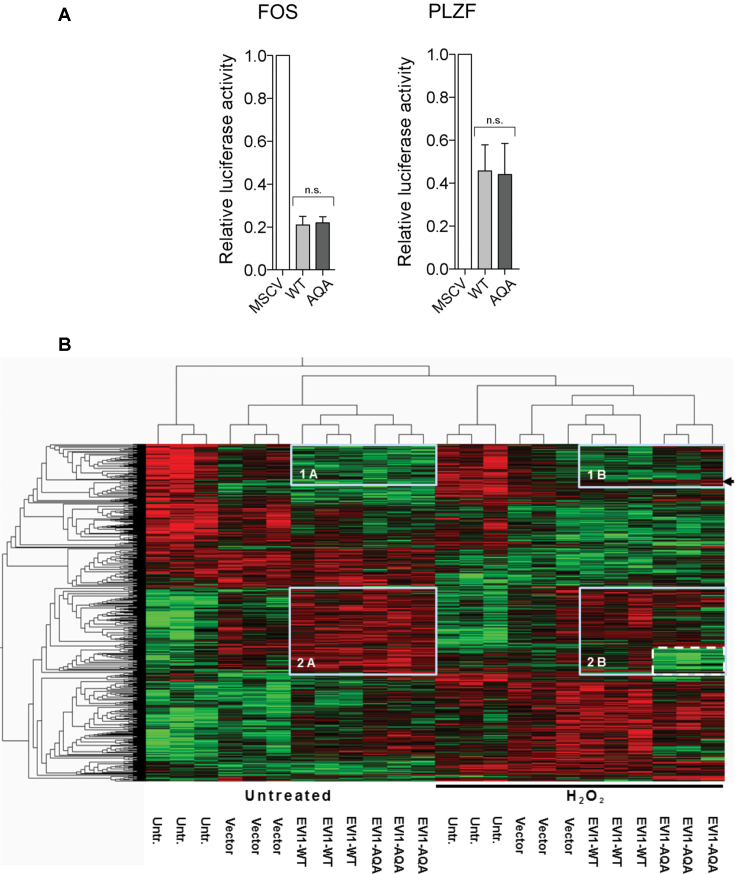
Figure 3.
Effect of EVI1-WT and EVI1-AQA on transcription. (A) Luciferase assays on promoters of EVI1-repressed PLZF (left panel) and FOS (right panel) transcripts (n = 4, t-test, ns: not significant). (B) Heat map illustration of significantly differentially expressed transcripts (P < 0.01) after transfection with EVI1-WT and EVI1-AQA of untreated cells (left half of the heatmap), and after treatment with H2O2 (150 μM, right half of the heat map, indicated by black line) (n = 1306). The heatmap was generated applying a group ANOVA analysis to the entire dataset. Clusters of EVI1 regulated transcripts were identified by dendrogram delineation, and boxed for repressed (1A and 1B), and upregulated transcripts (2A and 2B). Patterns of sub-clusters in H2O2 treated cells with different changes comparing EVI-WT with EVI1-AQA indicated by arrow in 1B and dashed box in 2B.

