Figure 6.
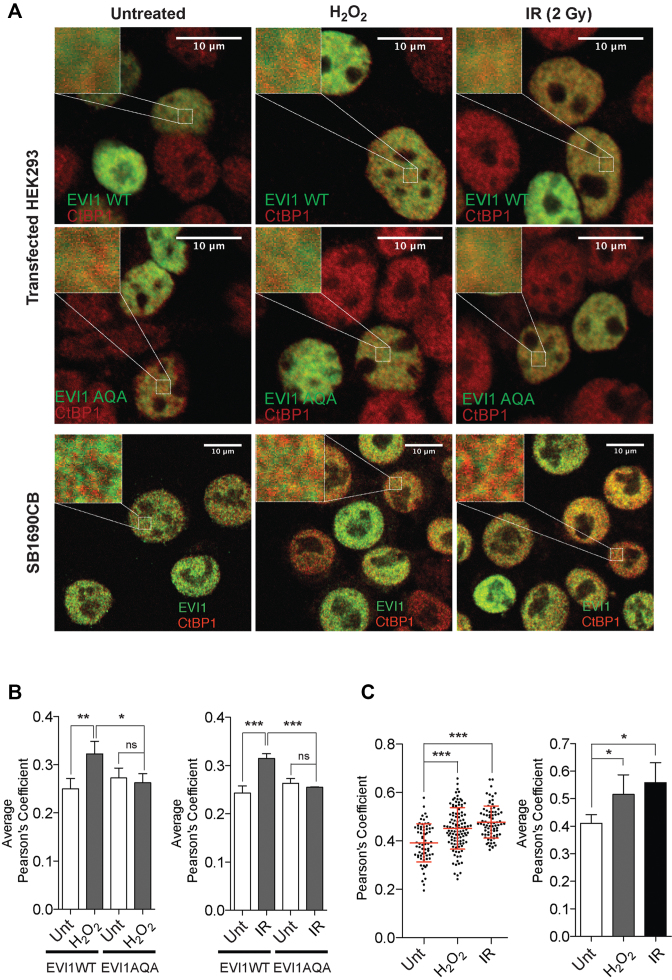
Nuclear association of EVI1 with CtBP1. (A) EVI1 (green) and CtBP1 (red) immunofluorescence signal of HEK293T cells transfected with EVI1-WT (upper panel) and EVI1-AQA mutant (middle panel), or SB1690CB AML cells (lower panel) after genotoxic stress induced either with H2O2 treatment or irradiation (2 Gy). Left top corner inserts represent 4 μm2 regions of interests (ROI) in HEK293T cells or 3 μm2 ROIs in SB1690CB cells (eight ROIs/cell analyzed). (B) Quantification of EVI1 and CtBP1 co-localization in EVI1-WT or EVI1-AQA transfected HEK293T cells after genotoxic stress. Degree of co-localization is expressed as Pearson's Coefficient (P’sC). Each bar represents the average P’sC of independent experiments (n = 3) for H2O2 (left panel) and irradiated cells (right panel). (C) Distribution of P’sC for endogenously expressed EVI1 and CtBP1 co-localization in SB1690CB leukemia cells after H2O2 treatment or irradiation. Each dot represents a single cell (left panel). Average P’sC of independent experiments (n = 3) plotted as bar graphs (right panel). Statistical analysis: one-way ANOVA (*P < 0.05, **P < 0.01, ***P < 0.001, ns = not significant).

