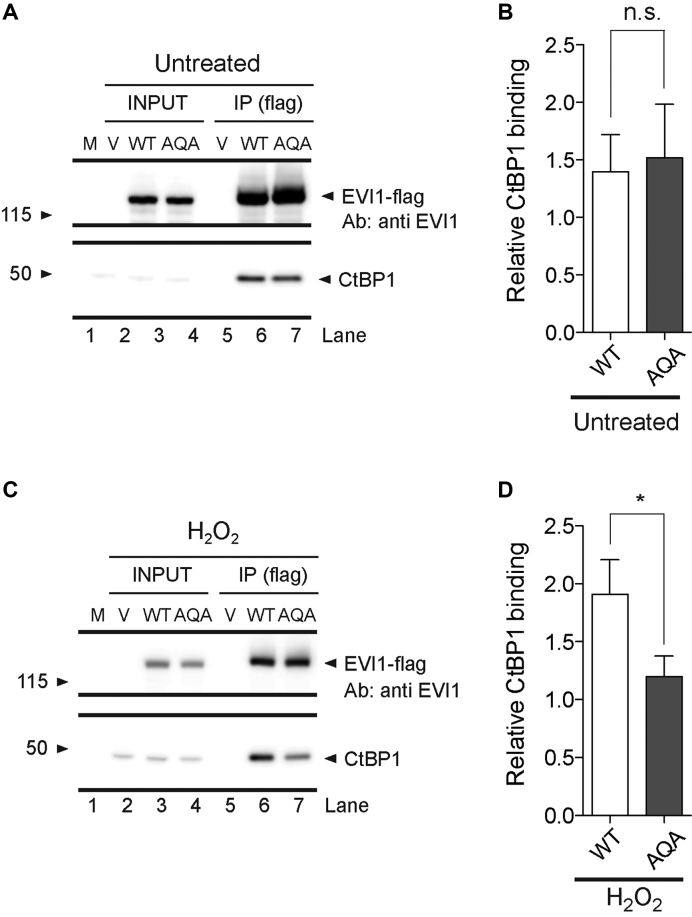
Figure 7.
Effect of genotoxic stress on EVI1-CtBP1 interaction. (A) Western blot analysis of flag-antibody immunoprecipitated tagged EVI1 and co-immunoprecipitated CtBP1 from total cell protein extracts of untreated Flag-tagged EVI1-WT or EVI1-AQA transfected HEK293 cells (upper panel: EVI1; lower panel: CtBP1). (B) Signal quantification of serial biological replicates (n = 3) at 3 min (n.s. = not significant, t-test). (C) Western blot analysis of flag-antibody immunoprecipitated EVI1 and co-immunoprecipitated CtBP1 from total cell protein extracts of H2O2 treated Flag-tagged EVI1-WT and EVI1-AQA transfected cells (upper panel: EVI1; lower panel CtBP1). (D) Signal quantification of biological replicates (n = 3) (*P < 0.05, t-test).

