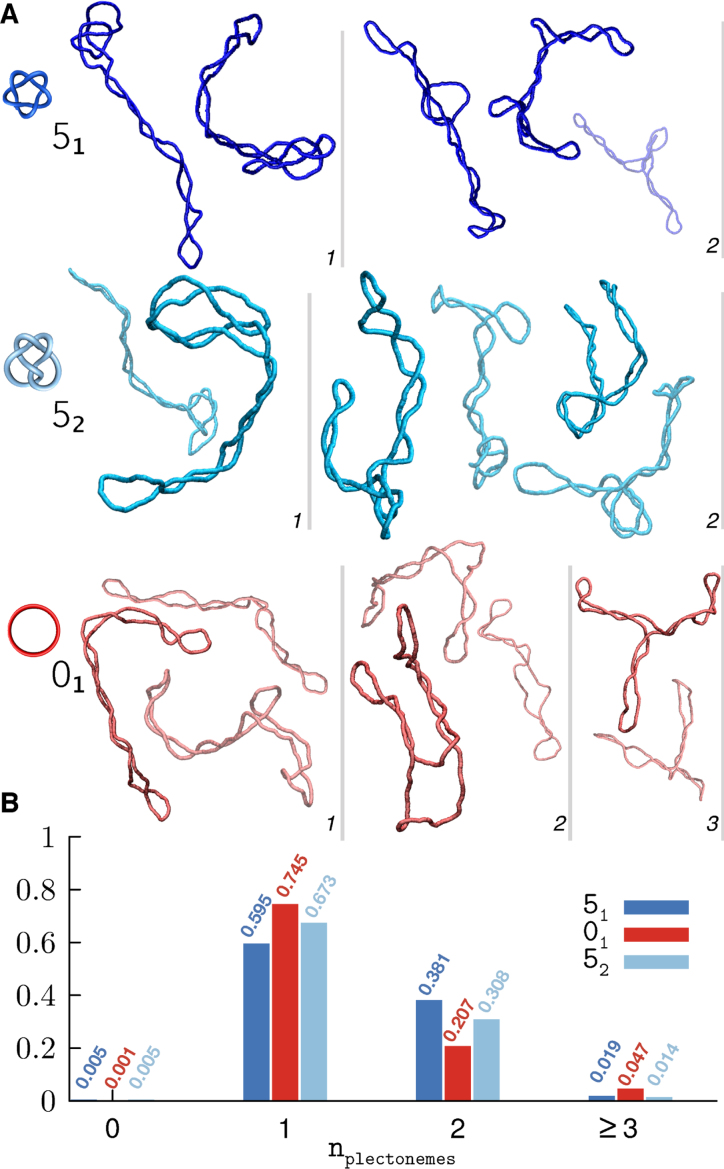
Figure 2.
(A) Typical snapshots of supercoiled DNA rings for the three considered topologies. The conformers are grouped by the number of plectonemes (in italics), which increases from left to right, and are shown in colours of different saturation for visual clarity. (B) Normalised histogram of the number of plectonemes observed for each topology.

