Figure 6.
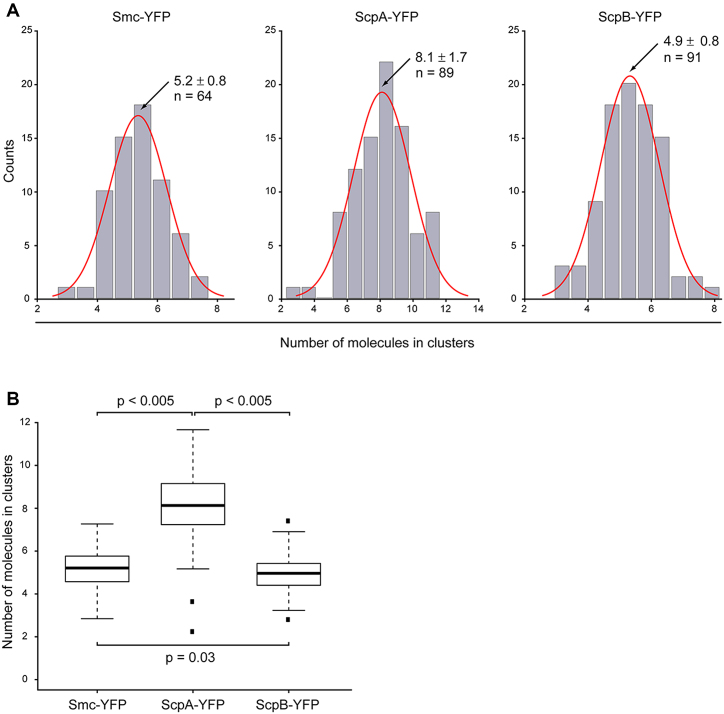
Analysis of numbers of molecules integrated in clusters. (A) Distribution of number of molecules in clusters for Smc-YFP, ScpA-YFP and ScpB-YFP. For Smc-YFP, 5.2 ± 0.8 molecules are integrated in clusters (n = 64), for ScpA-YFP 8.1 ±1.7 molecules are integrated in clusters (n = 89), and for ScpB-YFP 4.9 ± 0.8 molecules are integrated in clusters (n = 91). (B) Boxplot showing numbers of molecules integrated into clusters. There was no statistically significant difference between the numbers of molecules integrated into clusters for Smc-YFP and ScpB-YFP (P = 0.03), but ScpA-YFP showed a statistically significant higher number of molecules integrated into clusters (P < 0.005). Black dots are considered outliers (lie outside of 1.5 ITR).

