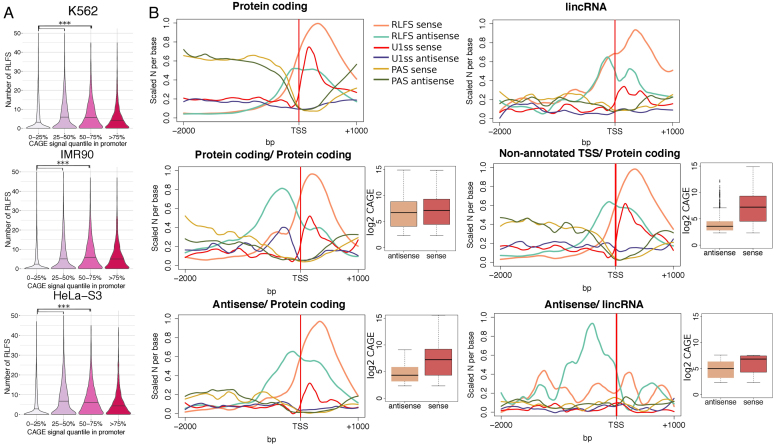
Figure 2.
RLFS boundaries correlate with TSSs and transcription directionality. (A) Distributions of the numbers of RLFSs at the proximity of promoter regions. To define unidirectional promoters, −500, +1 kb regions of annotated gene TSSs without intersecting TSSs on the opposite strand were considered (N = 52 900), CAGE clusters were defined as described in the ‘Materials and Methods’ section (CAGE-Seq data analysis); promoters were divided into four classes by the CAGE clusters signal intensity (0–25, 25–50, 50–75, 75–100 percentiles). For each cell line, the promoters with a single CAGE cluster were selected, and the numbers of overlapping RLFSs per promoter region were calculated. The black line on violin plot denotes median of the distribution; RLFSs were significantly enriched in promoters of moderately expressed genes (50–75% of CAGE signal intensity) compared to low (0–25%) and low-moderately expressed (25–50%) (P-value < 2.2e-16 by one-sided Wilcoxon rank sum test). (B) RLFS, U1 and PAS motif distributions on the sense and antisense DNA strands in promoters of stand-alone protein-coding genes (N = 4793), lincRNAs (N = 194) and divergent gene pairs: protein-coding/protein-coding (N = 522), protein-coding/antisense transcripts (N = 204), protein-coding/non-annotated transcripts (overlapping with a CAGE cluster on the antisense strand, N = 954) and lincRNA/antisense transcripts (N = 36). Promoters were classified as described in the ‘Materials and Methods’ section (defining unidirectional and divergent gene promoters). The sequence/signal count densities were scaled per maximum number considering sequences/signals from both sense and antisense strands. Red and brown box plots illustrate sequence/signal distributions of the total number of CAGE clusters on the sense and antisense strands downstream (1 kb) and upstream (2 kb) of the annotated TSS, respectively.

