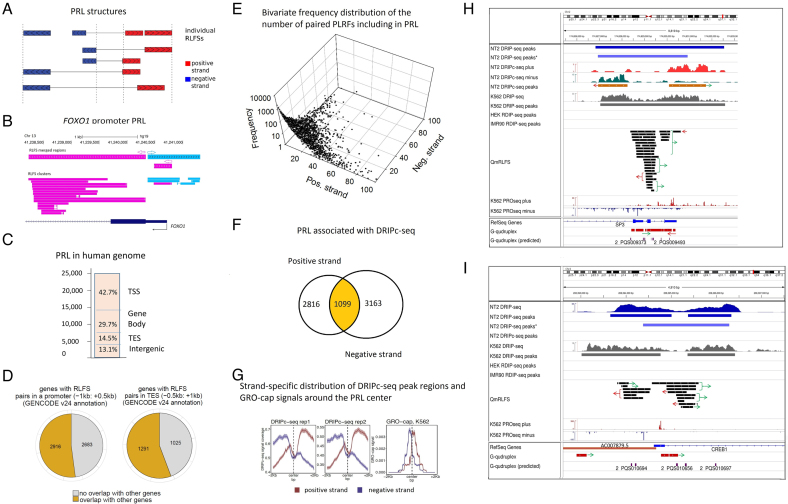
Figure 4.
Analysis of the paired reversed-forward RLFS loci (PRLs). (A) A schema for the identification of neighbor-paired RLFS loci on the forward and reverse DNA strands. The center of a PRL was defined as the middle point between the rightmost reverse-strand RLFS and the leftmost forward-strand RLFS in each pair. The model assumed that most of the pairs would be functional within such a sequence span and in the distal region approximately corresponding to two nucleosome spans. (B). PRL structure in the FOXO1 region, including the promoter, exon 1 and the 1st intron 5′ splice site. (C) The genome-wide RPL distribution (N = 24 296). TSS, TES, gene body and intergenic regions; they were defined similarly to Figure 2B. (D) The frequencies of the PRLs co-localized with the singleton (orphan) genes and the PRLs co-localized with the gene clusters defined at TSS- and TES- proximity regions. The left panel shows the numbers of genes with RPL with and without localization of other genes at the promoter proximity. The right panel shows the numbers of the genes with RPL with and without localization of other genes at the TES proximity. (E) The bivariate distribution of the number of RLFSs included in the PRL set, observed on the positive and negative DNA strands. For each strand, the power law-like frequency distribution that fit well by the Kolmogorov–Waring function has a long tail on the right side (71). This function specifies many sequence types and families, including RLFS (32,71). (F) Strand-specific DRIPc-seq peak regions density functions (NT2 cells) (47) are associated with PRL regions and asymmetrically localized on the PRL flanks. Strand-specific densities of DRIPc-seq peak regions (replicates 1 and 2) and GRO-cap (right) signals are distributed around the PRL center. The results are shown for the positive and negative DNA strands (depicted in red and blue, respectively). (G) Strand-specific distribution of DRIPc-seq peak regions and GRO-cap signals around the PRL center. The left and central panels show the density of DRIPc-seq peak region for two experimental replicates. The right panel shows the densities of the GRO-cap signals region around the PRL center. The results obtained from the genomes of K562 cells (72). (H) Co-localization analysis of the PRL defined within the SP3 gene promoter region. Experimental data integrated via UCSC genome browser tracks (done via R-loop DB tools (33)), including the RNA:DNA hybrid/R-loop profiles (DRIP-based experiments) and the experimental G4-rich region datasets downloaded from the GSE63874 NCBI GEO data repository. Computationally predicted canonical G4s and non-B DNA structures downloaded from the non-B DNA database https://nonb-abcc.ncifcrf.gov. (I) Co-localization analysis of the PRL predicted within the CREB1 gene promoter region. All tracks are the same as in panel H.

