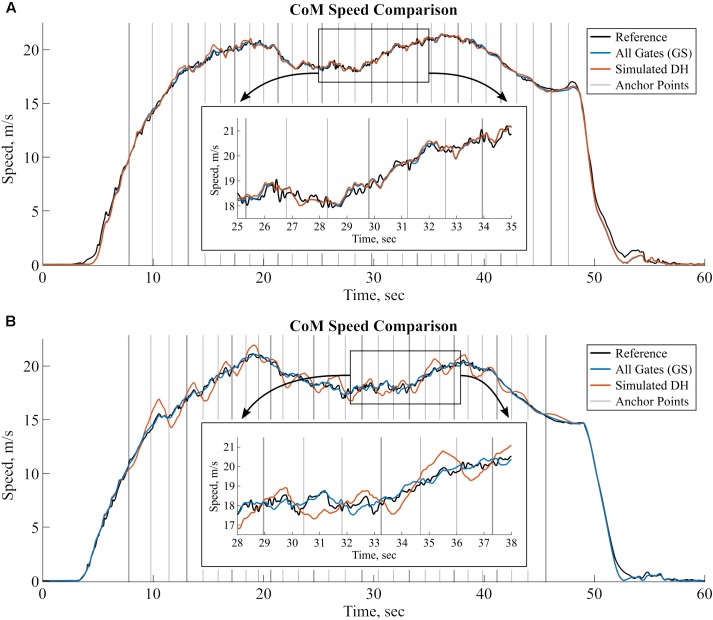
FIGURE 7.
CoM Speed comparison for two typical runs with different error behavior for the simulated DH. In both plots, reference CoM speed is shown in black, inertial sensor-based CoM speed with all anchor points (GS) is shown in blue, and the simulated DH is shown in red. Anchor points are marked with the vertical gray lines. For GS all anchor points were considered whereas for simulated DH only the anchor points marked in bold were considered. (A) A run with little to no change of speed between GS and simulated DH. (B) Another run with large precision decrease for simulated DH compared to GS.

