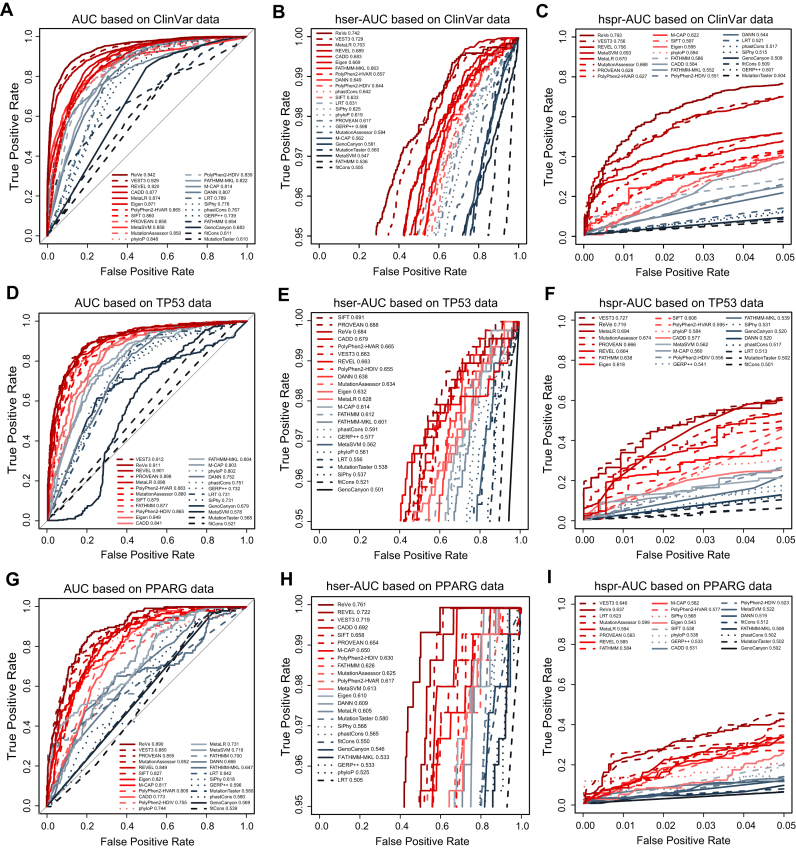
Figure 1.
Overall performance of the computational methods with the three sets of benchmark data. The AUC, hser-AUC and hspr-AUC of all computational methods are shown, based on germline variants of human genetic diseases from the ClinVar database (A–C), somatic variants of human cancers from the IARC TP53 database (D–F) and experimentally validated PPARG variants (G–I). The AUC, hser-AUC and hspr-AUC values for each computational method are shown in the figures. The solid lines represent function-prediction methods, the dashed lines represent conservation methods and the dotted lines represent ensemble methods. The performance measures of AUC, hser-AUC and hspr-AUC does not rely on the cutoff values. This figure is online available interactively at http://159.226.67.237/sun/roc/.

