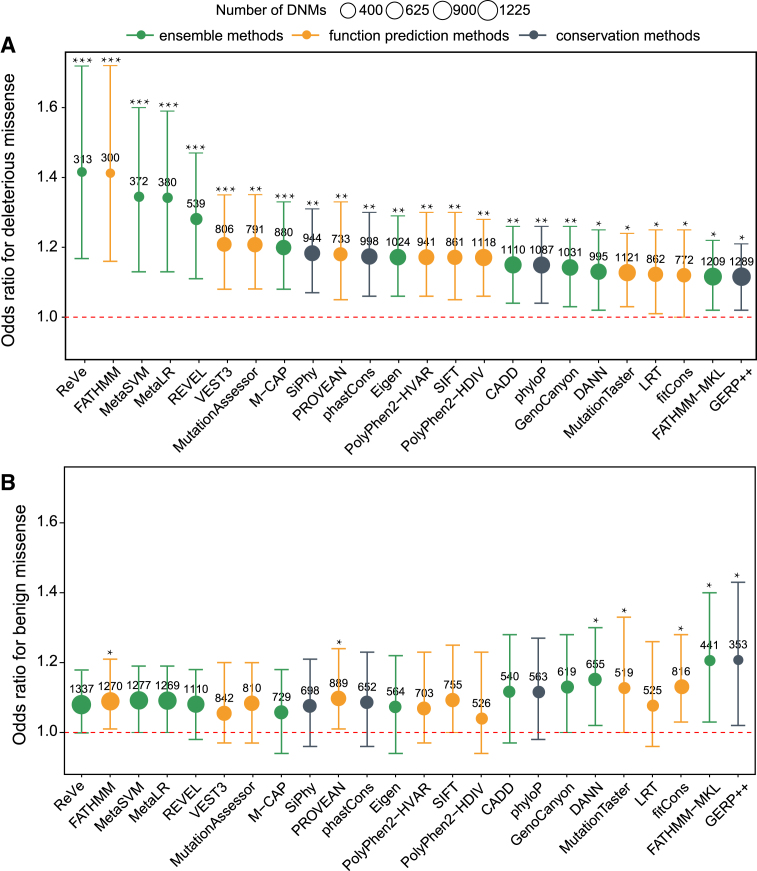
Figure 2.
Performance evaluations based on DNMs. The OR, 95% confidence interval and P-values were calculated by Poisson's ratio test. The area of each ball is proportional to the number of missense variants predicted to be deleterious or benign. The orange balls represent function-prediction methods, the dark gray balls represent conservation methods, and the green balls represent ensemble methods. A given missense variant with a predictive score of ReVe greater than 0.86 was regarded as a deleterious variant. *, P < 0.05; **, P < 0.01; ***, P < 0.001.

