Figure 1.
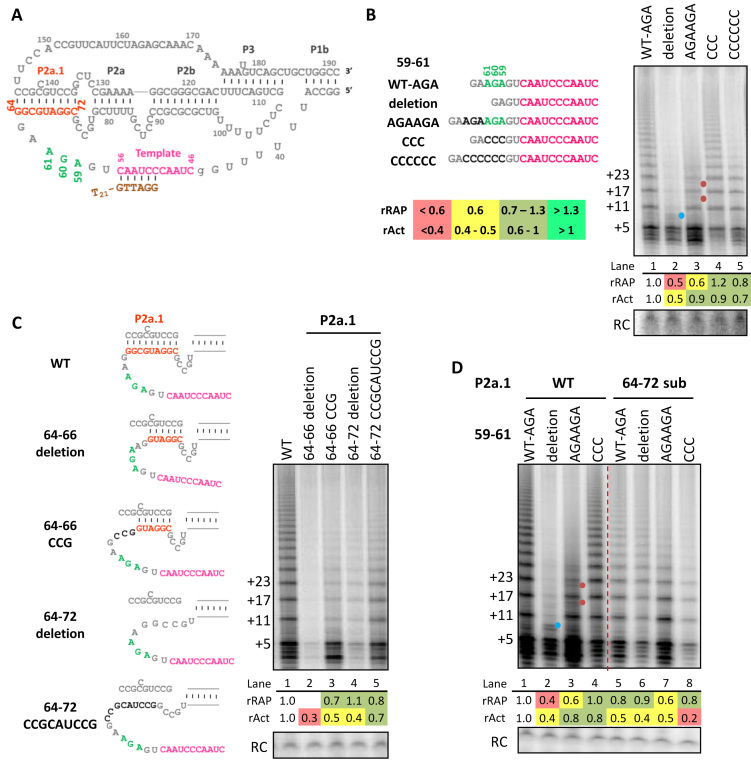
The template 3′-flanking single-stranded region length and P2a.1 stem differentially influence RAP and activity. (A) Diagram of the hTR t/PK with the proximal part of paired stem P1. Numbering indicates position within full-length hTR. Template is in pink, the 3′ template-flanking AGA59–61 is in green, and the bottom (5′) strand of P2a.1 in orange. Also shown is template alignment of the T21-GTTAGG primer used for activity assays in brown. Activity assays of RRL-reconstituted hTRmin mutants are shown with (B) template 3′-flanking 59–61 region length variations, (C) P2a.1 deletions or substitutions and (D) 59–61 and P2a.1 double mutations. Schematics for mutants are shown with mutated bases in darker gray. Assays were carried out using primer T21-GTTAGG in presence of all four dNTPs. The number of nucleotides added to the primer is indicated to the left. Here and in subsequent figure panels, the product precipitation recovery control (RC) was cropped from the faster-migrating region of the same gel. Blue dot indicates products from template 5′ boundary bypass, while red dot indicates products dissociated or stalled before complete repeat synthesis. Relative RAP (rRAP) values were calculated by dividing the collective intensities of products ≥2 repeats by the intensity of first-repeat products then normalizing the ratio to wild-type (WT) hTRmin enzyme. Relative activity (rAct) values were calculated by normalizing the collective intensities of all products to WT hTRmin enzyme. Values of rRAP and rAct are color-coded according to the key provided in (B) and Supplementary Figure S2, with severe defects indicated in red, moderate defects in yellow, levels in similar range as WT in light green, and improvements over WT in bright green. Similar results were obtained from two to four independent experimental replicates.

