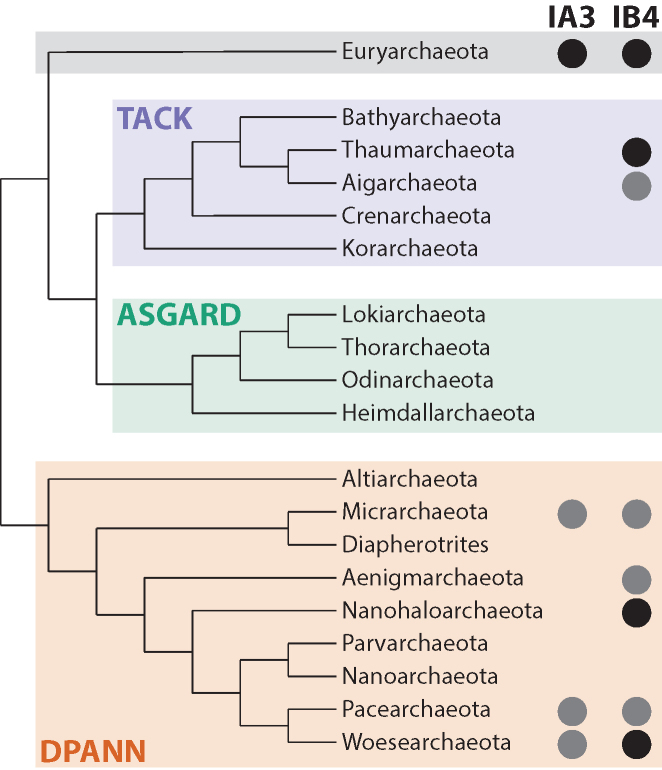
Figure 3.
Distribution of identified group I introns in archaeal phyla. Taxonomic assignments of IA3 and IB4 introns from Table 1 are shown on a cladogram of archaeal phyla and superphyla (54). Dark circles indicate occurrence of one or more introns with higher confidence assignments, where GenBank annotation and RDPClassifier agreed.

