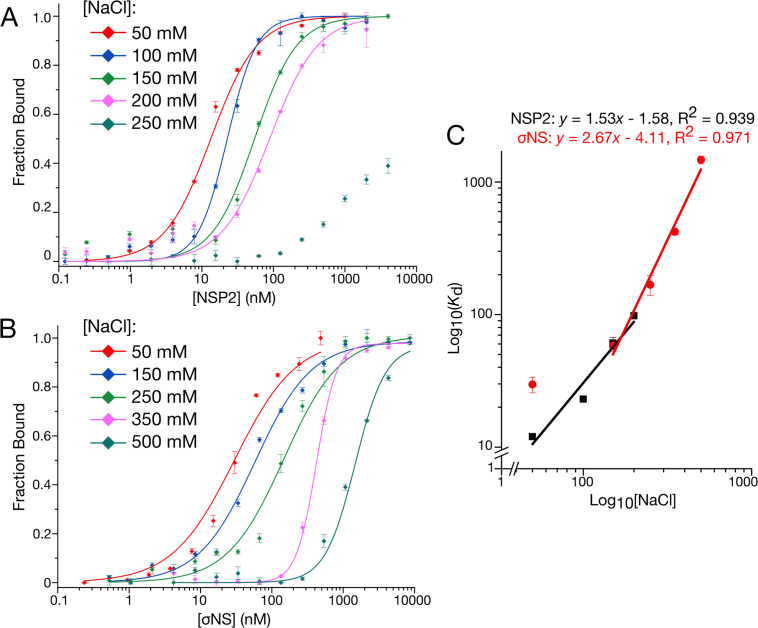
Figure 8.
NSP2 and σNS display different electrostatic contributions to RNA binding. (A and B) Salt-dependence of NSP2 (A) and σNS (B) binding to unstructured 20-mer ssRNA measured by fluorescence anisotropy. (C) Linear correlation between log(KD) and log([NaCl]) for both NSP2 (black) and σNS (red). Derived mean Kd ± sd (N = 3) values are summarized in Supplementary Table S3. The number of salt bridges contributing to RNA binding is estimated from fitted slopes, corresponding to <2 for NSP2 and 3–4 for σNS.

