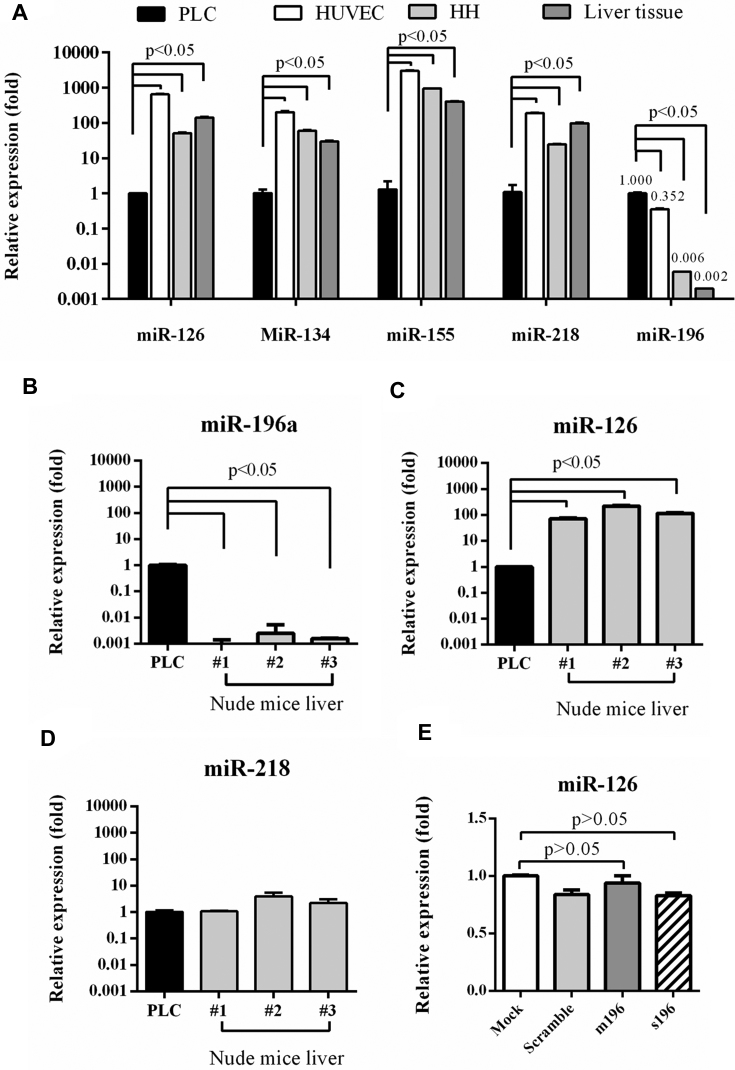
Figure 2.
Identification of OncoMiR and NormalMiR. (A) Expression of miR-126, miR-134, miR-155, miR-218 and miR-196a in PLC, HUVEC, human hepatocyte and liver tissue. (B–D) miR-196a (B), miR-126 (C) and miR-218 (D) levels in mouse livers and PLC cells. (E) miR-126 levels in BV-transduced PLC cells. The miRNA levels were analyzed by RT-qPCR and normalized to those in PLC. The data represent means ± SD of at least three independent experiments.

