
Fig. 3.
Rates of increase of select human leukocyte antigen (HLA)-adapted variants during the Saskatchewan epidemic.
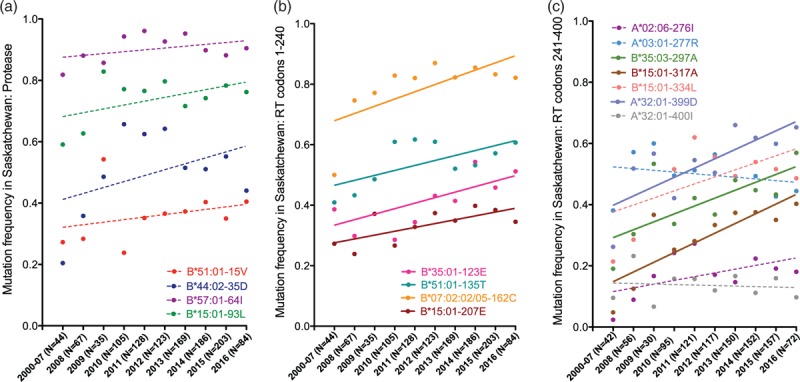
Annual frequencies (dots) and rates of change (regression lines) are depicted for the 15 HLA-associated adapted variants in Protease (Panel a), RT codons 1–250 (Panel b) and RT codons 251–400 (Panel c) whose frequencies were overall more than 10% higher frequency in Saskatchewan versus elsewhere in Canada and the USA. Sequences collected prior to 2008 are combined into a single group due to small N. The number of sequences analyzed per year is indicated on the x-axis. Variants whose annual rates of increase are statistically significant are shown as solid lines; others are shown as dotted lines.