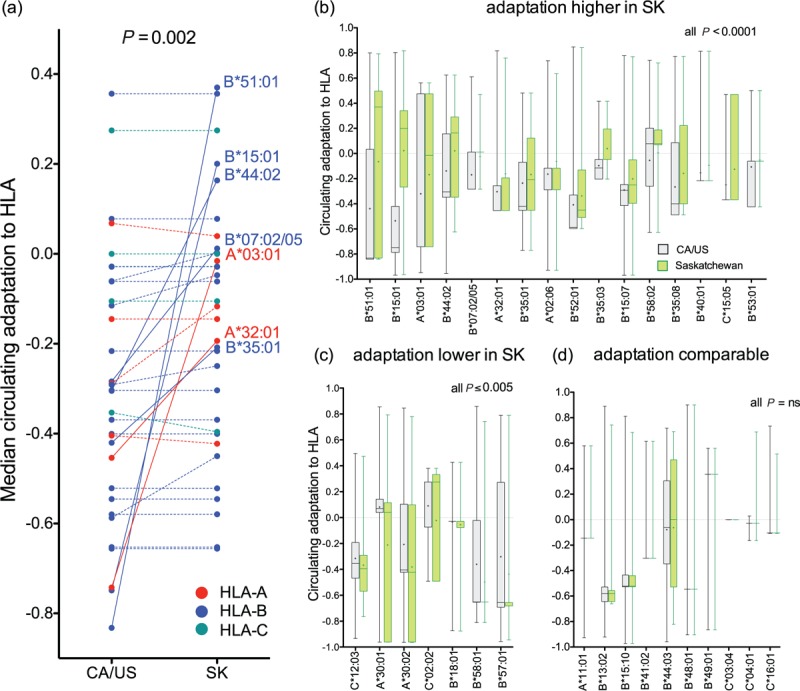
Fig. 4.
Comparison of human leukocyte antigen (HLA)-specific Pol adaptation scores in Saskatchewan vs. CA/US.

Panel a: Median HLA allele-specific adaptation scores of CA/US and Saskatchewan Pol sequences are shown as linked pairs, coloured according to the locus (HLA-A, B and C) to which the allele in question belongs. HLA alleles whose adaptation scores are more than 0.2 units higher in Saskatchewan versus CA/US are labeled and linked with solid lines; others are linked with dotted lines. Panel b: Paired histograms detailing adaptation distributions in Saskatchewan (green) and CA/US (gray) datasets for the 16 HLA alleles whose adaptation scores were significantly higher in Saskatchewan vs. CA/US after correction for multiple comparisons (all pairwise comparisons P < 0.0001 by Wilcoxon-rank sum test). Box horizontal line and edges represent median and interquartile range; cross represents mean, whiskers denote range. Panel c: Paired histograms depicting overall HLA allele-specific adaptation distributions for the 7 HLA alleles whose adaptation scores were significantly lower in Saskatchewan vs. CA/US after multiple comparisons correction. Panel d: Paired histograms depicting overall HLA allele-specific adaptation distributions for the 10 HLA alleles whose adaptation scores were not significantly higher in Saskatchewan vs. CA/US after multiple comparisons correction.
