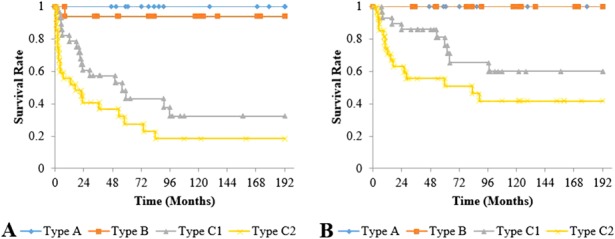
Fig. 8 A-B.

Graph (A) shows the cumulative survival rate with collapse as the endpoint, and graph (B) shows those undergoing hip arthroplasty as the endpoint for JIC classification. (A) Survival rates at 10 years were 100% for Type A, 94% (95% CI, 81.9%–100%) for Type B, 32% (95% CI, 12.8%–51.9%) for Type C1, and 18% (95% CI, 2.8%–34.0%) for Type C2; and differences were observed between Types A and C1 (p < 0.001), Types A and C2 (p < 0.001), Types B and C1 (p = 0.001), and Types B and C2 (p < 0.001). (B) Survival rates at 10 years were 100% for Types A and B, 60% (95% CI, 38.9%–81.0%) for Type C1, and 42% (95% CI, 22.1%–61.2%) for Type C2; and differences were observed between Types A and C1 (p = 0.016), Types A and C2 (p < 0.001), Types B and C1 (p = 0.012), and Types B and C2 (p < 0.001).
