
Figure 4.
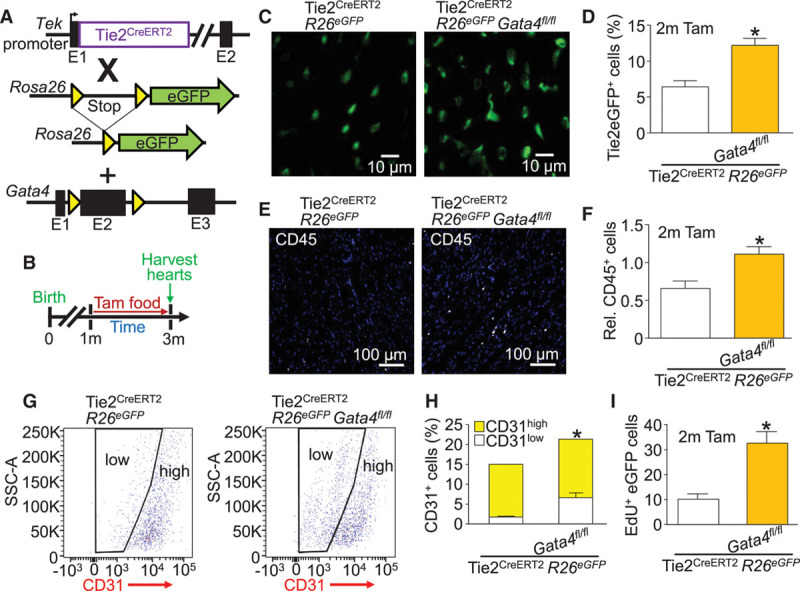
Global Tie2-lineage deletion of Gata4 expands the immature endothelial cell population and increases diapedesis. A, Genetic models with the indicated alleles or transgenes in mice that were crossed. B, Experimental design of the protocol used in this figure. The Tie2 promoter from the Tek gene was used to drive the Cre-ERT2 cDNA. C, Representative cardiac histological sections showing Tie2 lineage–traced eGFP+ cells (green) from the indicated genotypes of mice. D, Quantification of Tie2 lineage–traced eGFP+ endothelial cells by flow cytometry from the interstitial fraction in hearts of the indicated lines of mice. Error bars are SEM, n=3 per group, *P<0.05 vs. Tie2CreERT2 R26eGFP. E, Representative cardiac histological sections showing CD45+ cells (white) and DAPI (blue) from the indicated genotypes of mice. F, Quantification of CD45+ cells by flow cytometry of the interstitial fraction in the hearts of the indicated lines of mice. Error bars are SEM, n=3 per group, *P<0.05 vs. Tie2CreERT2 R26eGFP. G, Flow cytometry plots showing cardiac CD31+ cells with gating to display low- and high-expressing cells from the indicated genotypes of mice. H, Quantification of CD31low, CD31high, and total CD31+ cells from flow cytometry of the interstitial fraction of hearts of the indicated genotypes of mice. Error bars are SEM, n=3 per group, P=0.0257 for CD31 low comparison, P=0.1799 for CD31 high comparison, and P<0.0001 for total CD31+ comparison vs. Tie2CreERT2 R26eGFP. I, Quantification of EdU+ nuclei in Tie2 lineage-traced eGFP+ cardiac endothelial cells from cardiac histological sections from the indicated genotypes of mice. Error bars are SEM, n=3 per group (6 EdU-stained sections per heart). *P<0.05 vs. Tie2CreERT2 R26eGFP. DAPI indicates 4′,6-diamidino-2-phenylindole; EdU, 5-ethynyl-2′-deoxyuridine; eGFP, enhanced green fluorescent protein; SSC-A, side scatter area; and Tam, tamoxifen.