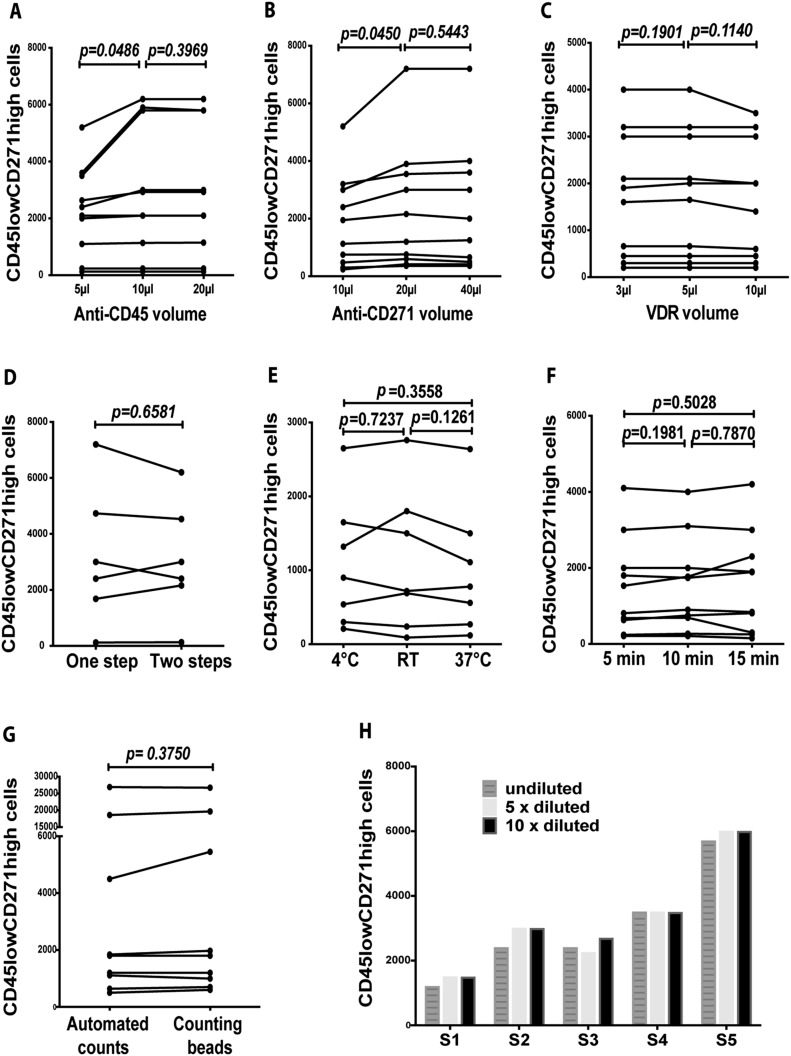
Fig. 1.
Optimization of the staining and counting of CD45lowCD271high cells using the Attune flow cytometer. Figs. 1-A, 1-B, and 1-C Comparison of CD45lowCD271high cell counts quantified using 3 different volumes of anti-CD45 and CD271 antibodies and Vybrant DyeCycle Ruby (VDR) dye (Student paired t test; n = 10 samples). Figs. 1-D, 1-E, and 1-F Comparison of CD45lowCD271high cell counts quantified using 1-step and 2-step staining (Student paired t test; n = 6 samples), at different staining temperatures (Student paired t test; n = 7 samples; RT = room temperature), and after 5, 10, and 15-minute staining (Student paired t test, n = 10 samples). Fig. 1-G Comparison of CD45lowCD271high cell counts quantified using automated counting or using counting beads, on the Attune flow cytometer (Wilcoxon matched-pairs signed-rank test; n = 9 samples). Fig. 1-H The CD45lowCD271high cell counts were quantified in bone marrow aspirates that were stained undiluted or diluted ×5 or ×10 (n = 5 samples; S = sample).

