Fig. 4.
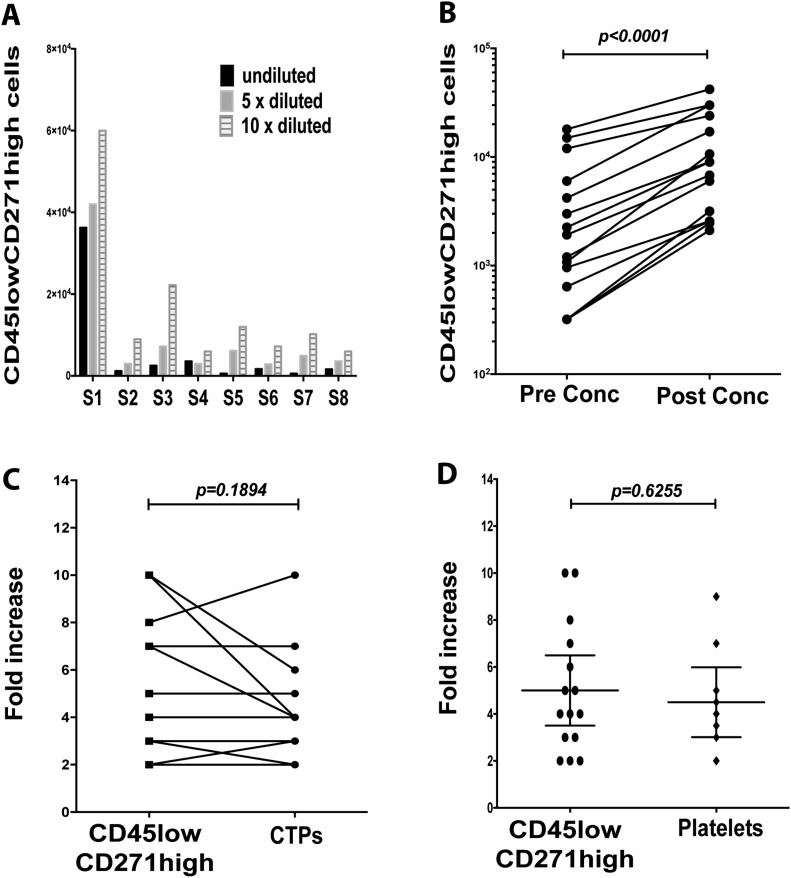
Assessment of CD45lowCD271high cells in bone marrow concentrates. Fig. 4-A The samples of bone marrow concentrates were either undiluted or diluted ×5 or ×10 before the counting of CD45lowCD271high cells (n = 8 samples; S = sample). Fig. 4-B The CD45lowCD271high cell counts were compared between pre-concentration (conc) and post-concentration samples (Wilcoxon matched-pairs signed-rank test; n = 15 samples). Fig. 4-C The fold increase of CD45lowCD271high cell counts was compared with the fold increase in CTPs after bone marrow concentration (Student paired t test; n = 13 samples). Fig. 4-D The mean fold increase (and 95% CI) of CD45lowCD271high cells (calculated using the Attune-based method) and platelets (calculated using the Sysmex cell counter) were compared after bone marrow concentration (unpaired t test; n = 15 samples for CD45lowCD271high cells and n = 10 samples for platelets).

