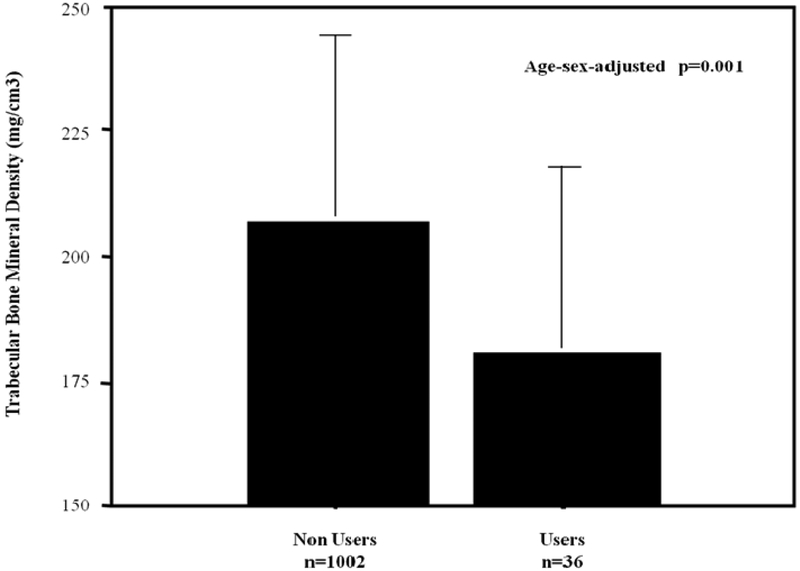
Figure 1. Relationship between proton pump inhibitors (PPI) use and volumetric bone mineral density of trabecular area (vBMDt).
The figure depicts in the vertical axis vBMDt and in the horizontal axis participants categorized according to PPI use.
The difference in vBMDt between PPI users (N=36), green column, and PPI non-users (N=1002), yellow column, was statistically significant after adjustment for age and sex (p=0.001).

