
Figure 1.
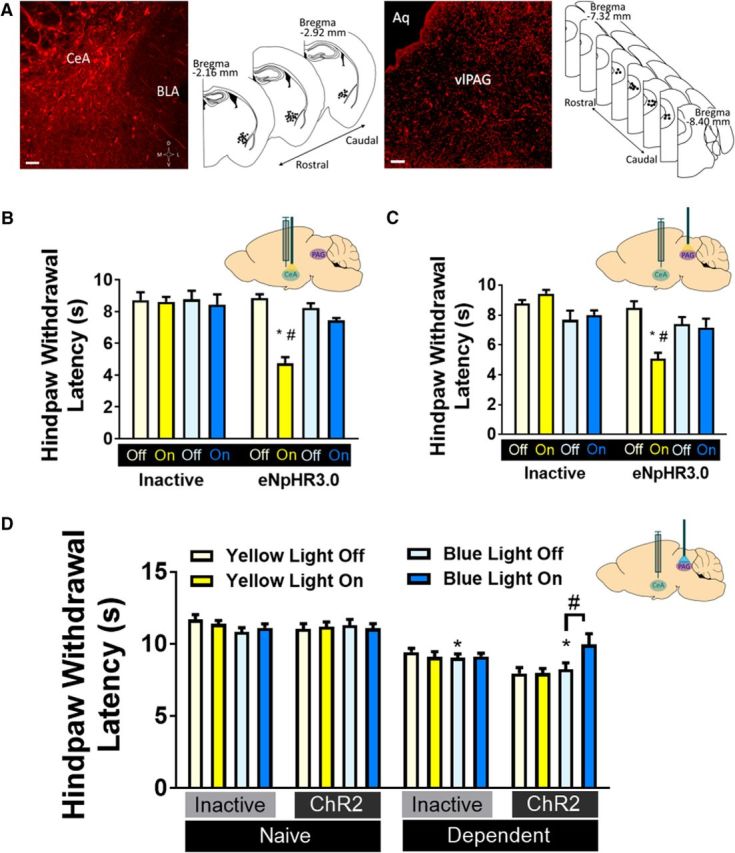
CeA-PAG projections mediate thermal nociception in rats. A, Virus expression. Left, Representative 20× image of hSyn-mCherry+ neurons in CeA, and map of virus placements. Scale bar, 100 μm. Right, representative 20× image of hSyn-mCherry+ terminals in PAG, and map of cannulae placements. Scale bar, 50 μm. BLA, Basolateral amygdala; Aq, aqueduct. B, Thermal hyperalgesia is induced by yellow light inactivation of CeA neurons (inset) transfected with eNpHR3.0 (n = 7 or 8/group). *p < 0.05 versus inactive virus. #p < 0.05 versus yellow light off. C, Thermal hyperalgesia is induced by yellow light inactivation of CeA terminals in PAG (inset) transfected with eNpHR3.0 (n = 7 or 8/group). *p < 0.05 versus inactive virus. #p < 0.05 versus yellow light off. D, Alcohol dependence-induced thermal hyperalgesia was reversed by blue light activation of CeA terminals in PAG (inset) transfected with ChR2 (n = 7–11/group). *p < 0.05 versus inactive virus. #p < 0.05 versus blue light off. B–D, Data are mean ± SEM. Hindpaw withdrawal latencies (s) in Hargreaves Test in response to light stimulation. Yellow bars represent yellow light trials. Blue bars represent blue light trials.