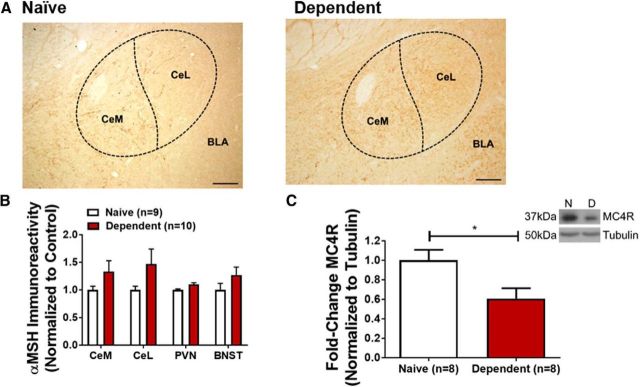
Figure 4.
Alcohol dependence reduces MC4R expression in CeA. A, 10× image of αMSH expression in CeA of naive (left) and alcohol-dependent (right) rat. Approximate positions of CeA and BLA indicated. Scale bar, 200 μm. CeM, Medial subdivision of CeA; CeL, lateral subdivision of CeA. B, Average expression of αMSH in CeA, BNST, and PVN of alcohol-dependent (red) and naive (white) rats. C, CeA MC4R expression is significantly decreased in CeA of alcohol-dependent rats (red) compared with naive controls (white). *p < 0.05. Inset, Representative image of MC4R and tubulin levels from naive (N) and alcohol-dependent (D) rats. B, C, Data are mean ± SEM.

