Figure 3.

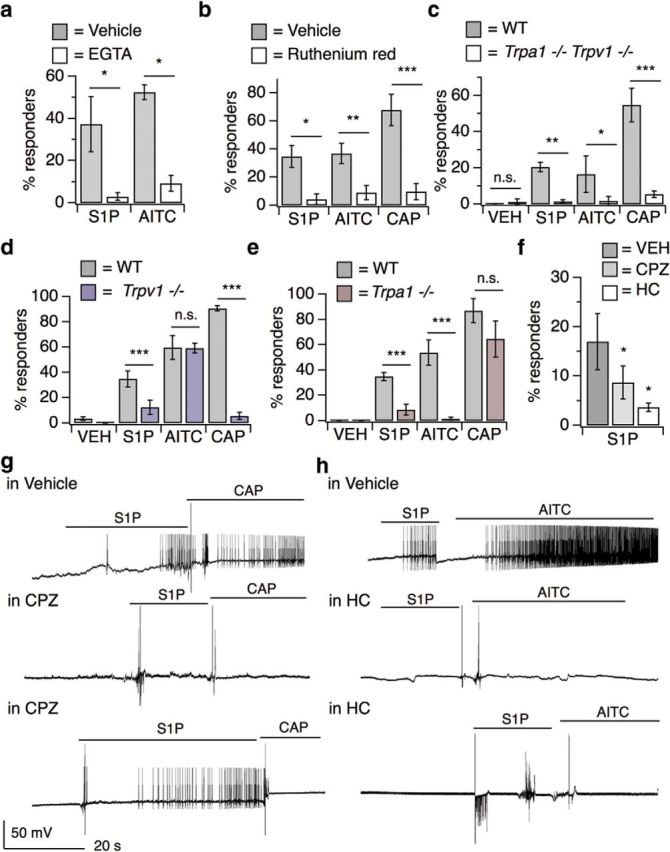
S1P triggers neuronal activation in distinct subsets of nociceptors and pruriceptors. a, Percentage DRG neurons responding to S1P and AITC in Ca2+ Ringer's and 10 mm EGTA Ringer's; p < 0.0001 [one-way ANOVA (F(3,11) = 8.291); n = 4 wells of ∼100 neurons each per treatment]. Error bars indicate mean ± SD. Sidak's multiple-comparisons p-values are represented on graph: *pS1P = 0.01; *pAITC = 0.0163. b, Percentage responders to 1 μm S1P, AITC, and capsaicin in vehicle and 10 μm ruthenium red; p < 0.0001 [one-way ANOVA (F(5,17) = 17.42); n = 5 wells of ∼100 neurons each per treatment]. Error bars indicate mean ± SD. Sidak's multiple-comparisons p-values are represented on graph: *pS1P = 0.048; **pAITC = 0.004; ***pCAP < 0.0001. c, Percentage responders to vehicle, S1P, AITC, and capsaicin in Trpa1/Trpv1+/+ and −/− DRG neurons; p < 0.0001 [one-way ANOVA (F(7,40) = 8.555); n = 2 age-matched mice per genotype]. Error bars indicate mean ± SD. Sidak's multiple-comparisons p-values are represented on graph: pVEH = 0.99; **pS1P = 0.0075; *pAITC = 0.04; ***pCAP = 0.0003. d, Percentage responders to vehicle, S1P, AITC, and capsaicin in Trpv1+/+ and Trpv1−/− neurons; p < 0.0001 [one-way ANOVA (F(7,179) = 72.67); n = 3 age-matched mice per genotype]. Error bars indicate mean responses ± SEM. Sidak's multiple-comparisons p-values are represented on graph: ***pS1P < 0.0001; pAITC = 0.80; ***pCAP < 0.0001. e, Percentage responders to vehicle, S1P, AITC, and capsaicin in Trpa1+/+ and Trpa1−/− neurons; p < 0.0001 [one-way ANOVA (F(7,210) = 105); n = 3 age-matched mice per genotype]. Error bars indicate mean responses ± SEM. Sidak's multiple-comparisons p-values are represented on graph: ***pS1P < 0.0001; ***pAITC < 0.0001; pCAP = 0.07. f, Effect of 50 μm CPZ (TRPV1 antagonist) and 50 μm HC-030031 (HC; TRPA1 antagonist) versus DMSO-Ringer's vehicle on S1P-evoked Ca2+ responses in cultured DRG neurons; p < 0.0001 [one-way ANOVA (F(8,30) = 84.32); n = 3 wells of ∼100 neurons each per treatment]. Error bars indicate mean responses ± SD. Dunnetts's multiple-comparisons p-values are represented on graph: *pCPZ vs. VEH = 0.04; *pHC vs. VEH = 0.03. g, Whole-cell current-clamp recordings of S1PR3+ DRG neurons from S1pr3mCherry/+ animals pretreated for 5–10 min with vehicle (1% DMSO in Ringer's) or 50 μm CPZ and subsequently exposed to 1 μm S1P followed by 1 μm capsaicin (CAP), indicated by lines. Top, Recording from a neuron that responded to S1P and CAP. Middle, Recording from a neuron that responded to neither S1P nor CAP. Bottom, Recording from a neuron that responded to S1P but not CAP. In these experiments, 5 of 6 S1PR3+ cells that received vehicle responded to S1P and 5 of 6 responded to CAP; 3 of 8 cells that received CPZ responded to S1P and 0 of 8 cells responded to CAP (n = 3 animals). h, Whole-cell current-clamp recordings of S1PR3+ DRG neurons from S1pr3mCherry/+ animals pre-treated for 5–10 min with vehicle (1% DMSO in Ringer's) or 50 μm HC-030031 (HC) and subsequently exposed to 1 μm S1P followed by 100 μm AITC, indicated by lines. Top, Recording from a neuron that responded to S1P and AITC. Middle, Recording from a neuron that responded to neither S1P nor AITC. Bottom, Recording from a neuron that responded to S1P but not AITC. In these experiments, 4 of 5 S1PR3+ cells that received vehicle responded to S1P and 2 of 5 responded to AITC; 4 of 11 cells that received HC responded to S1P and 0 of 11 cells responded to AITC (n = 3 animals).
