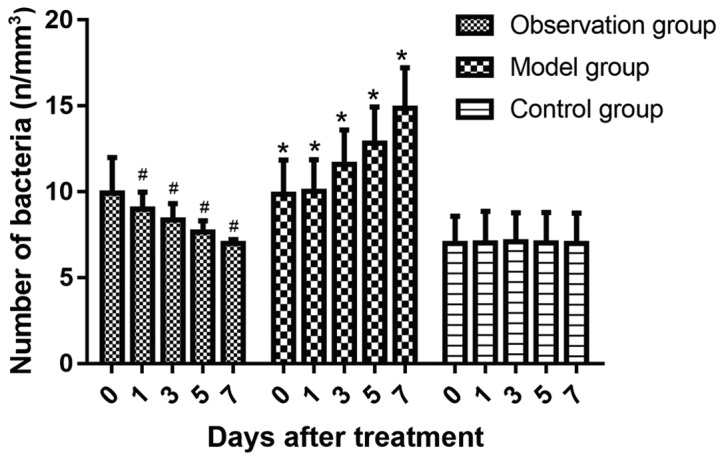
Figure 3.

Comparison of serum WBC levels (109/l) at different time-points in rats. Compared with that in the control group, the serum WBC in the model group increased significantly (P<0.05), and the WBC content in the observation group decreased significantly after treatment compared with the model group (P<0.05). *P<0.05, compared with the control group. #P<0.05, compared with model group.
