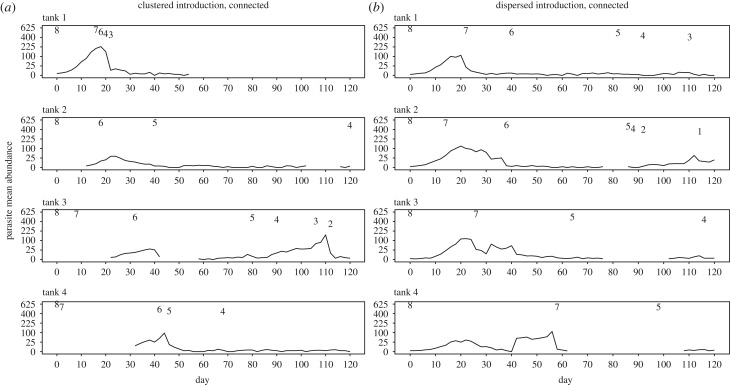
Figure 1.
Mean parasite abundance over time (square-root scaled for graphing purposes) from one representative replicate of the (a) high parasite clustered metapopulation and (b) low parasite dispersed metapopulation. Fish numbers are recorded when they change across the top of each graph. Note that single instances of zero-values may not represent true zeros for the parasite population, as detection is not perfect and fish may be cryptically infected from which parasite populations may resurge. Zero-values for two or more consecutive counting days are assumed to be true zeros.

