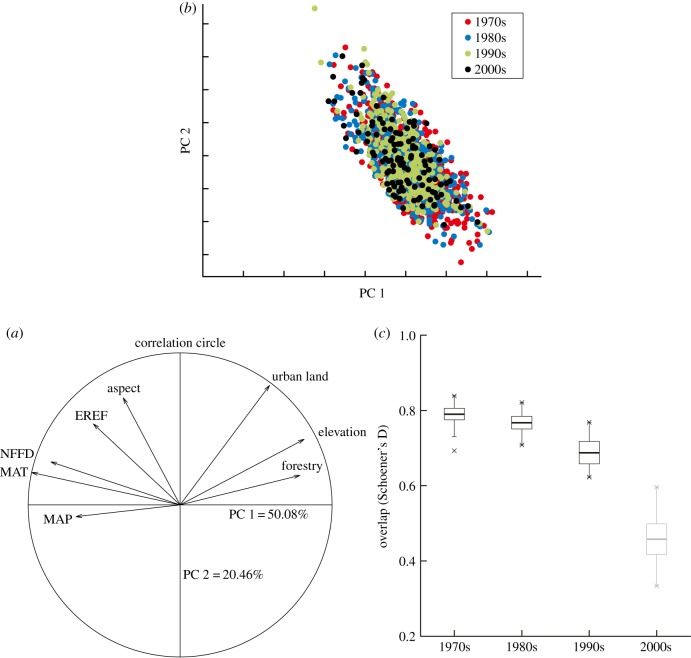
Figure 2.
(a) Species niches projected in the environmental space defined by PCA calibrated on all environmental variables for all periods (see text for more details). PC1 and PC2 represent the first two principal components, explaining 70.54% of the total variability. The correlation circle shows the variance contribution of axes 1 (PC1) and 2 (PC2). (b) Dots represent species distribution in the environmental space; and different colours represent different time periods. (c) Comparison between partial niche and total niches for each time period. Box plots represent Schoener's D values measured considering 100 random subsamples of the total niche with a sample size equivalent to the occurrence data available for each period. The bold lines indicate the mean values, X's indicate extreme values, and light grey boxes indicate non-significant relationships. (Online version in colour.)

