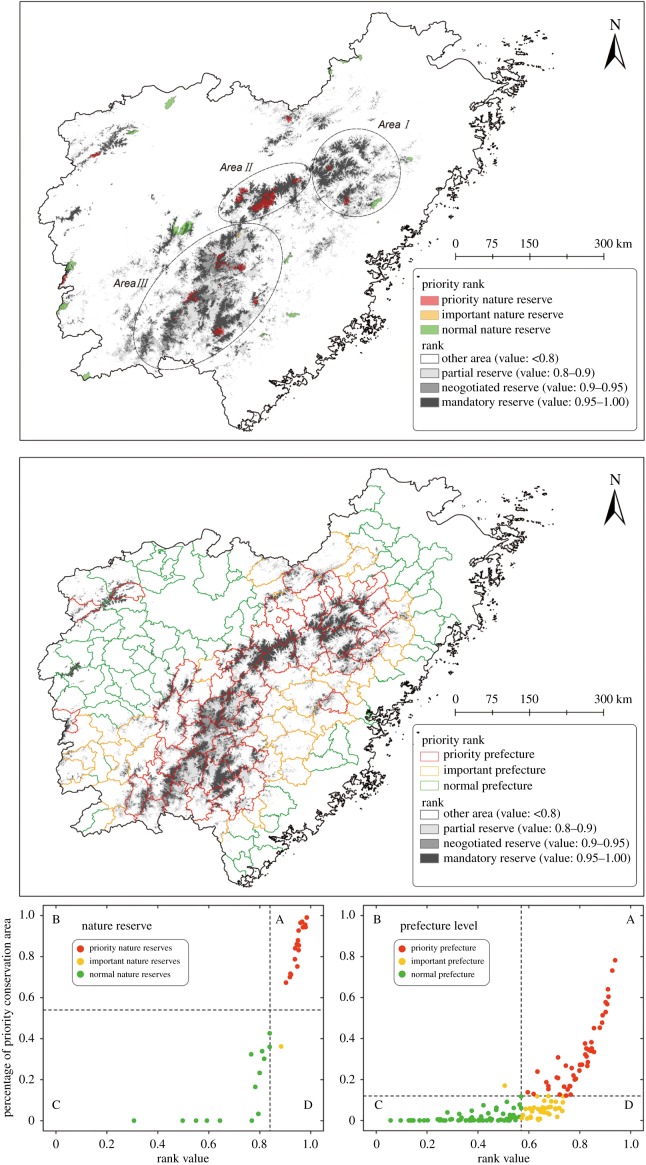
Figure 4.
(1) Results from the zonation conservation ranking of the landscape with the cost layer. (2) The priority nature reserves and prefectures according to zonation conservation ranking. Red dots indicate priority level, yellow dots important level and green dots indicate normal level. Bottom left: the dashed-line y-axis represents the average percentage of priority conservation areas. Bottom right: the dashed-line y-axis indicates the average rank for the 33 nature reserves or 151 prefectures. (Online version in colour.)

